Overview
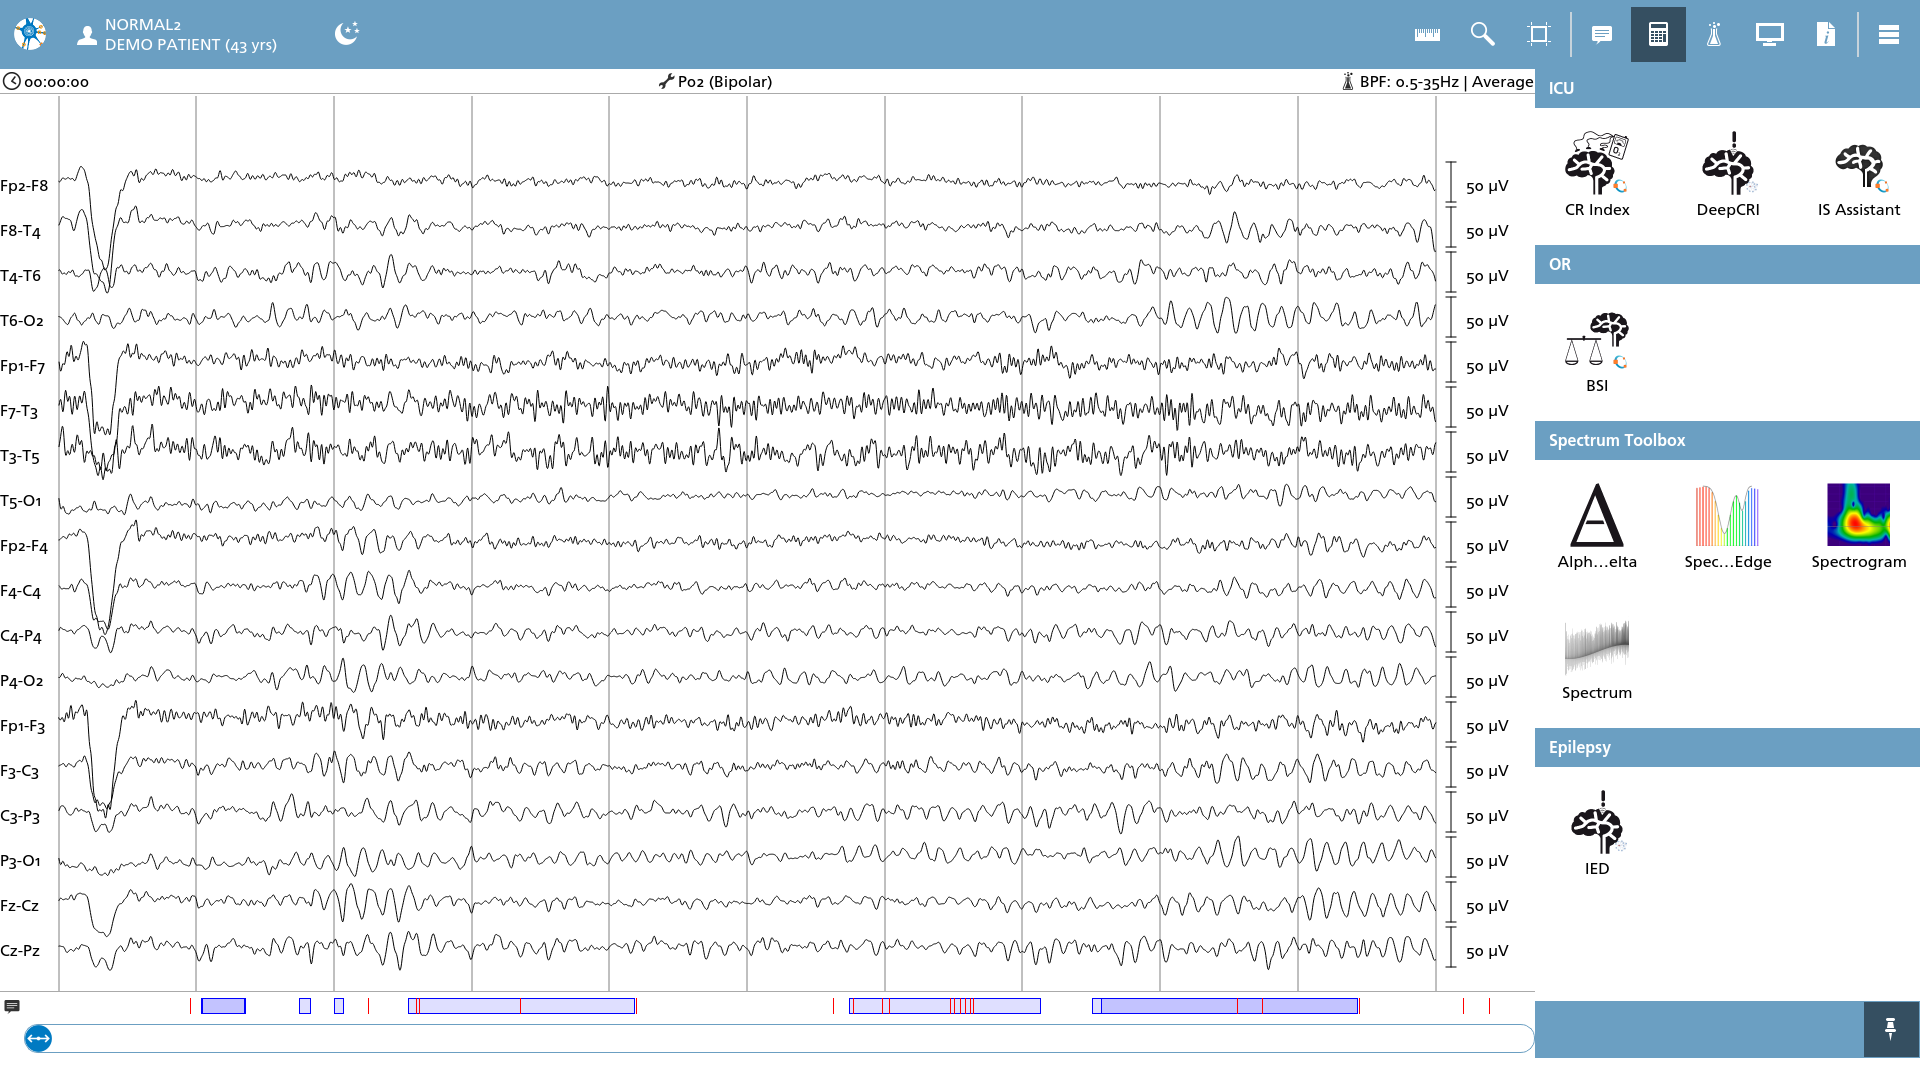
In this overlay, all configured analyses are displayed, allowing for selection to be utilized on the EEG. When an analysis is selected, it is executed for the entirety of the EEG. If a specific subsection of the EEG is to be analyzed, it is necessary to use the selection tool to mark a beginning and endpoint prior to selecting an analysis.
It is important to note that the results of the analyses presented here should never replace expert medical opinion regarding diagnosis, treatment, or any related matters. Always review the original underlying EEG data and consult a qualified expert for interpretation!
Signal Input
When no modifications are made to the analysis inputs, all EEG signals are transmitted to the analysis. In this scenario, the analysis engine internally filters out signals that are not present in the 10-20 system. For most analyses, this approach is adequate; however, for certain analyses, it may not be desirable to include all signals (for instance, in Spectrum Analysis, where only O1 and O2 may be pertinent). For further information, refer to this section in the configuration guide, and customize the desired input channels as necessary.
Utilizing non-standard labels that deviate from the international 10-20 system may lead to undesirable analysis outputs or analyses that do not yield any results. It is crucial to relabel signals in your file or configure a custom input signal selection for the intended analysis. The available signals in each measurement can be accessed from the measurement information overlay.
It is essential to always verify your signals before conducting measurements. Perform sanity checks on elements such as eye-blinks to ensure that the polarity of your measurements aligns with international standards. Additionally, check for artifacts or noisy measurements, unusually labeled signals, disconnected electrodes, montaged recordings instead of common reference recordings, and so forth.
As a general guideline: if extensive modifications are required in the built-in montages to adequately display your signals, it may indicate challenges in achieving proper analysis results.
Analysis Output
Analyses can produce two types of output: a dedicated result element or a trend output. Dedicated result elements are displayed separately as a viewing element and can be closed or hidden using the navigator. Trend output is incorporated into a trend viewing element, merging several trends into one cohesive view.
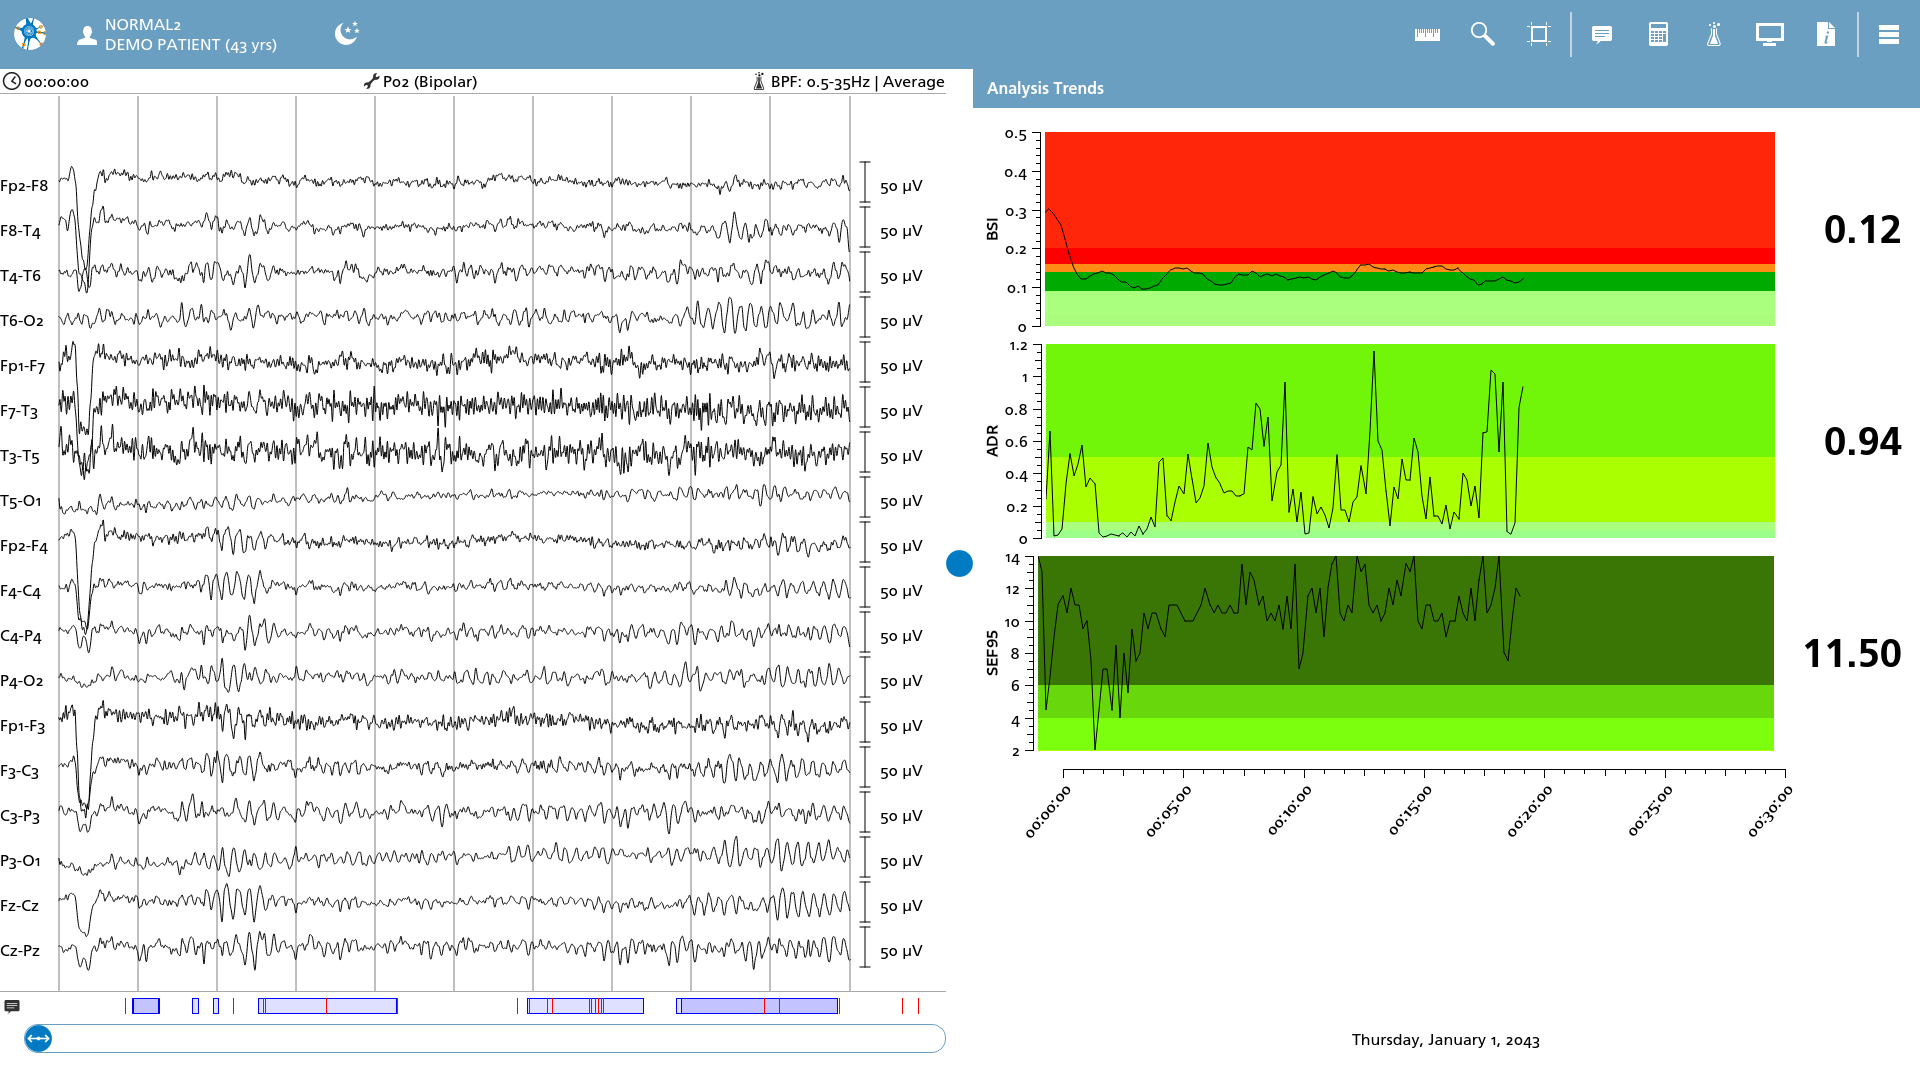
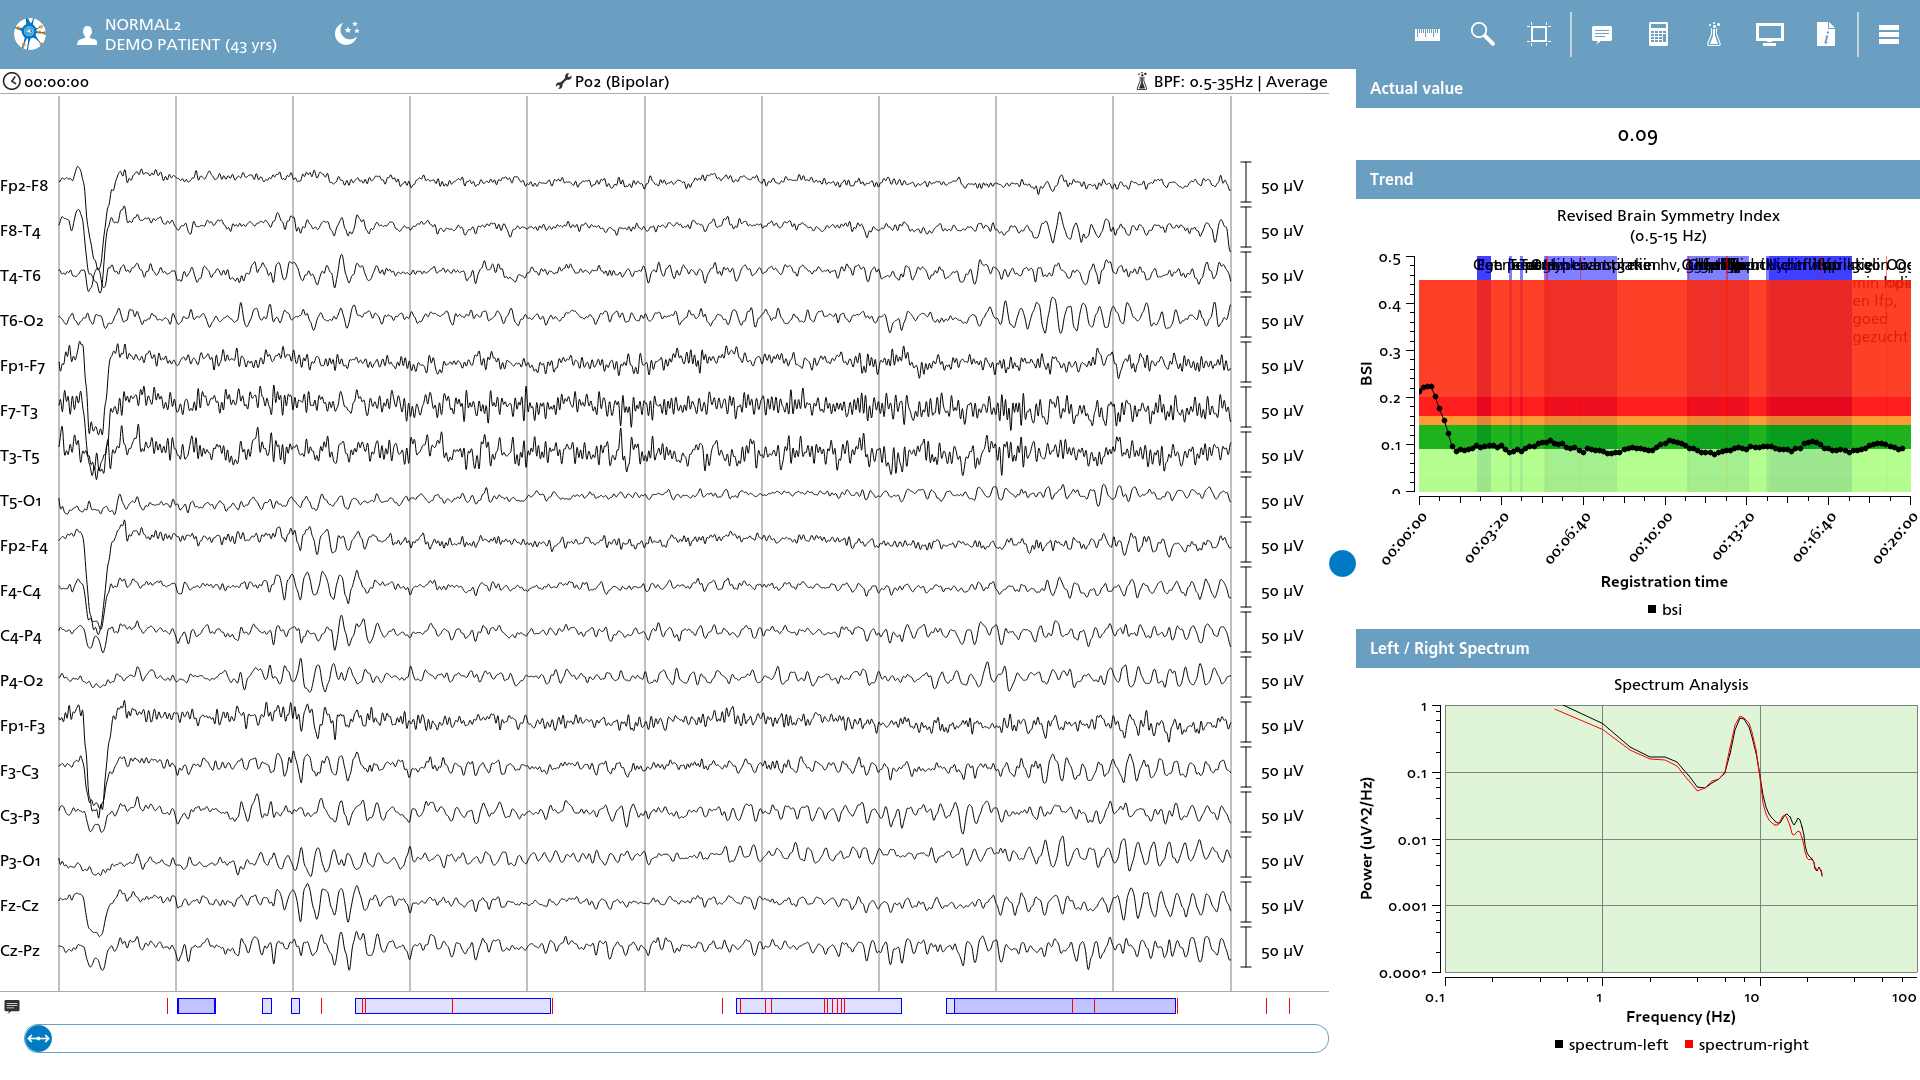
Interacting with an analysis output graph by clicking or tapping allows users to adjust the file position of the EEG to the chosen time. This functionality facilitates easy navigation to specific analysis results within the EEG data.
Available Analyses
NeuroCenter® EEG offers a variety of analyses. Depending on your platform and license type, the following analyses are accessible (listed in alphabetical order):

Alpha / Delta Ratio
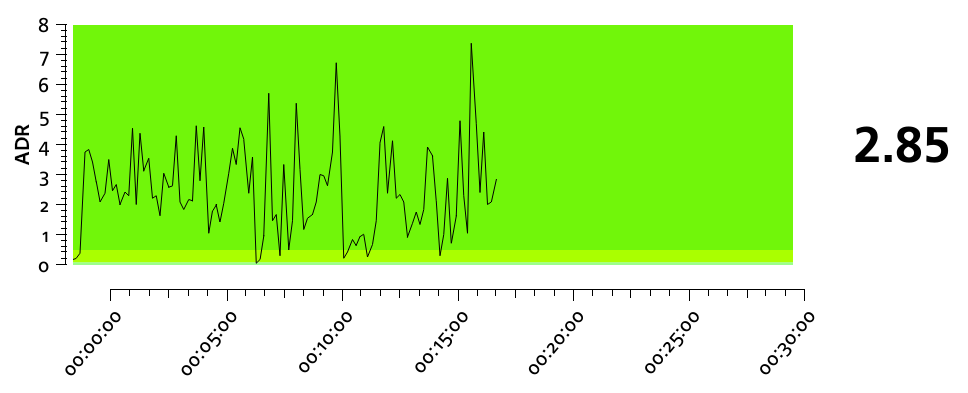
The alpha / delta ratio analysis computes the mean power in the alpha band (7.5 Hz - 12.5 Hz) relative to the mean power in the delta band (0.5 Hz - 4 Hz). A new data point is calculated and plotted in a trend output every 10 seconds.

Brain Symmetry Index (BSI)
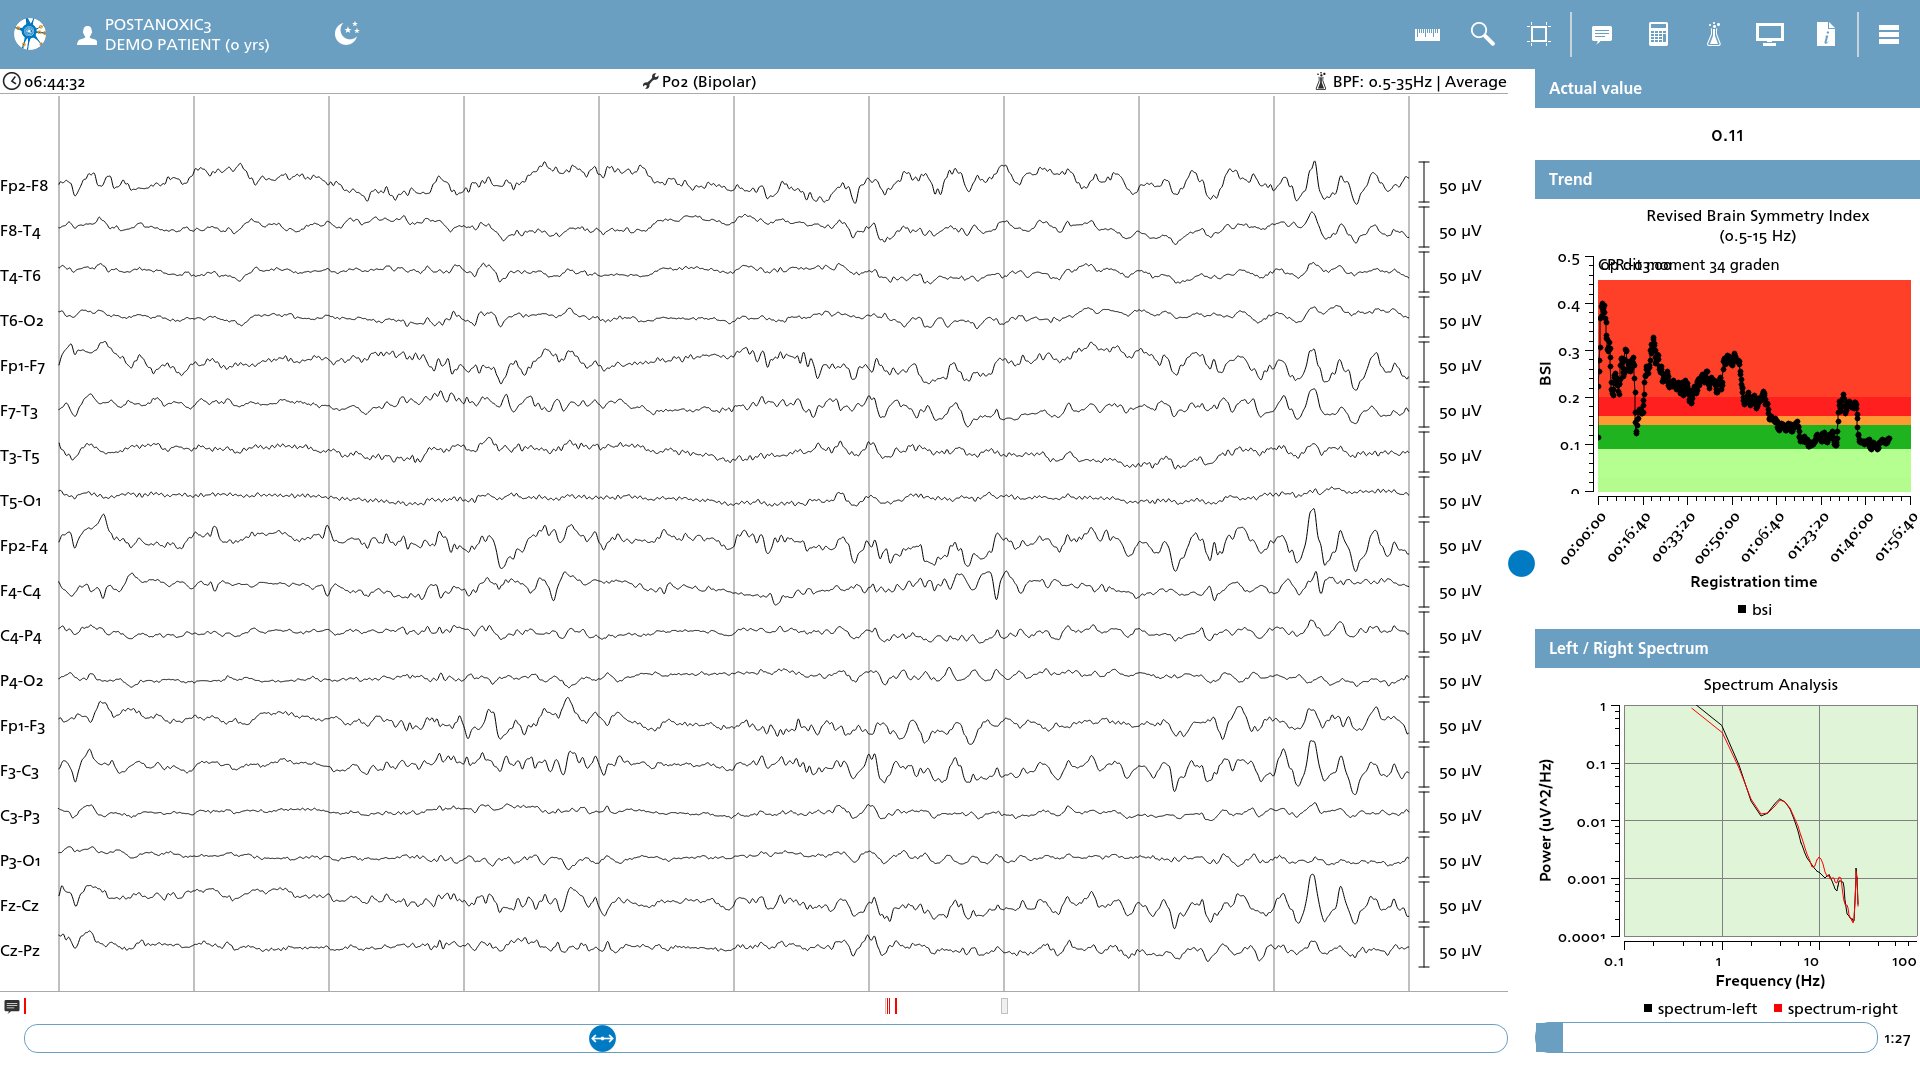
The Brain Symmetry Index (BSI) is a valuable metric employed to assess asymmetry in electroencephalography (EEG) readings. This analysis involves calculating the mean power spectrum of both the left and right hemispheres at intervals of every 10 seconds, utilizing a 10-20 bipolar montage for accuracy. The resulting values are divided, and the absolute value of this division is normalized to a range between 0 and 1, which is then represented in a trend output. Additionally, the spectral analyses for both the left and right hemispheres are displayed separately, along with the most recently computed BSI value.

Cerebral Recovery Index (CRI)
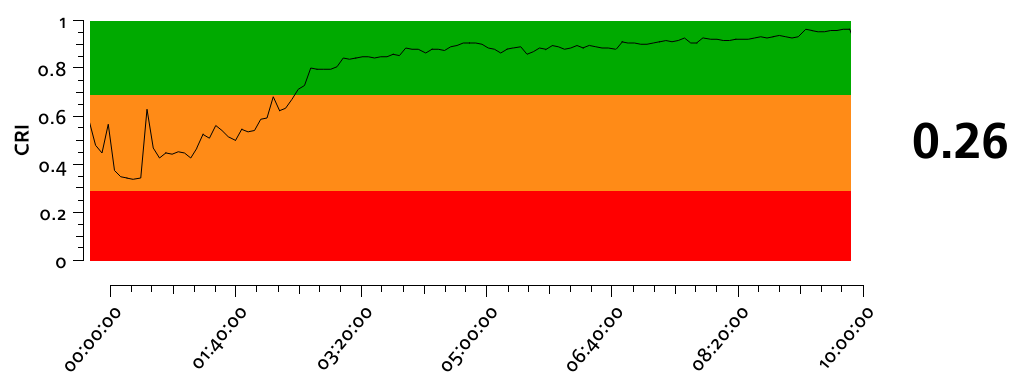
The Cerebral Recovery Index (CRI) is a sophisticated machine learning algorithm designed to aid in the prediction of neurological outcomes in comatose patients. This analysis involves the extraction of various features from a 5-minute electroencephalogram (EEG) recorded in a 10-20 bipolar montage. These features are then weighted according to a predefined internal model that incorporates specific thresholds. The resulting output is normalized to a scale between 0 and 1, which can then be represented visually in a trend output.
Deep Cerebral Recovery Index (DeepCRI)
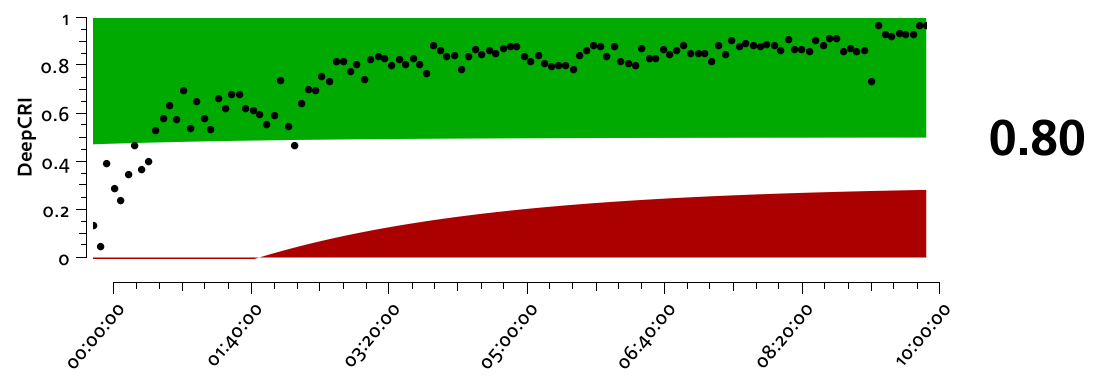
The Deep Cerebral Recovery Index (DeepCRI) is an advanced deep learning model designed to assist in predicting neurological outcomes for patients in a comatose state. This analysis involves processing data in 5-minute segments using a 10-20 montage, resulting in a normalized value ranging from 0 to 1, derived from the model's output. The resulting data is then visually represented in a trend plot.
To ensure the accurate representation of the trend background, which reflects recovery indications, it is crucial to establish the time of Cardiopulmonary Resuscitation (CPR). This can be achieved by incorporating a marker annotation that includes the label ‘CPR:-hh:mm’, where -hh:mm specifies the relative time elapsed between the initiation of CPR and the commencement of the EEG measurement.

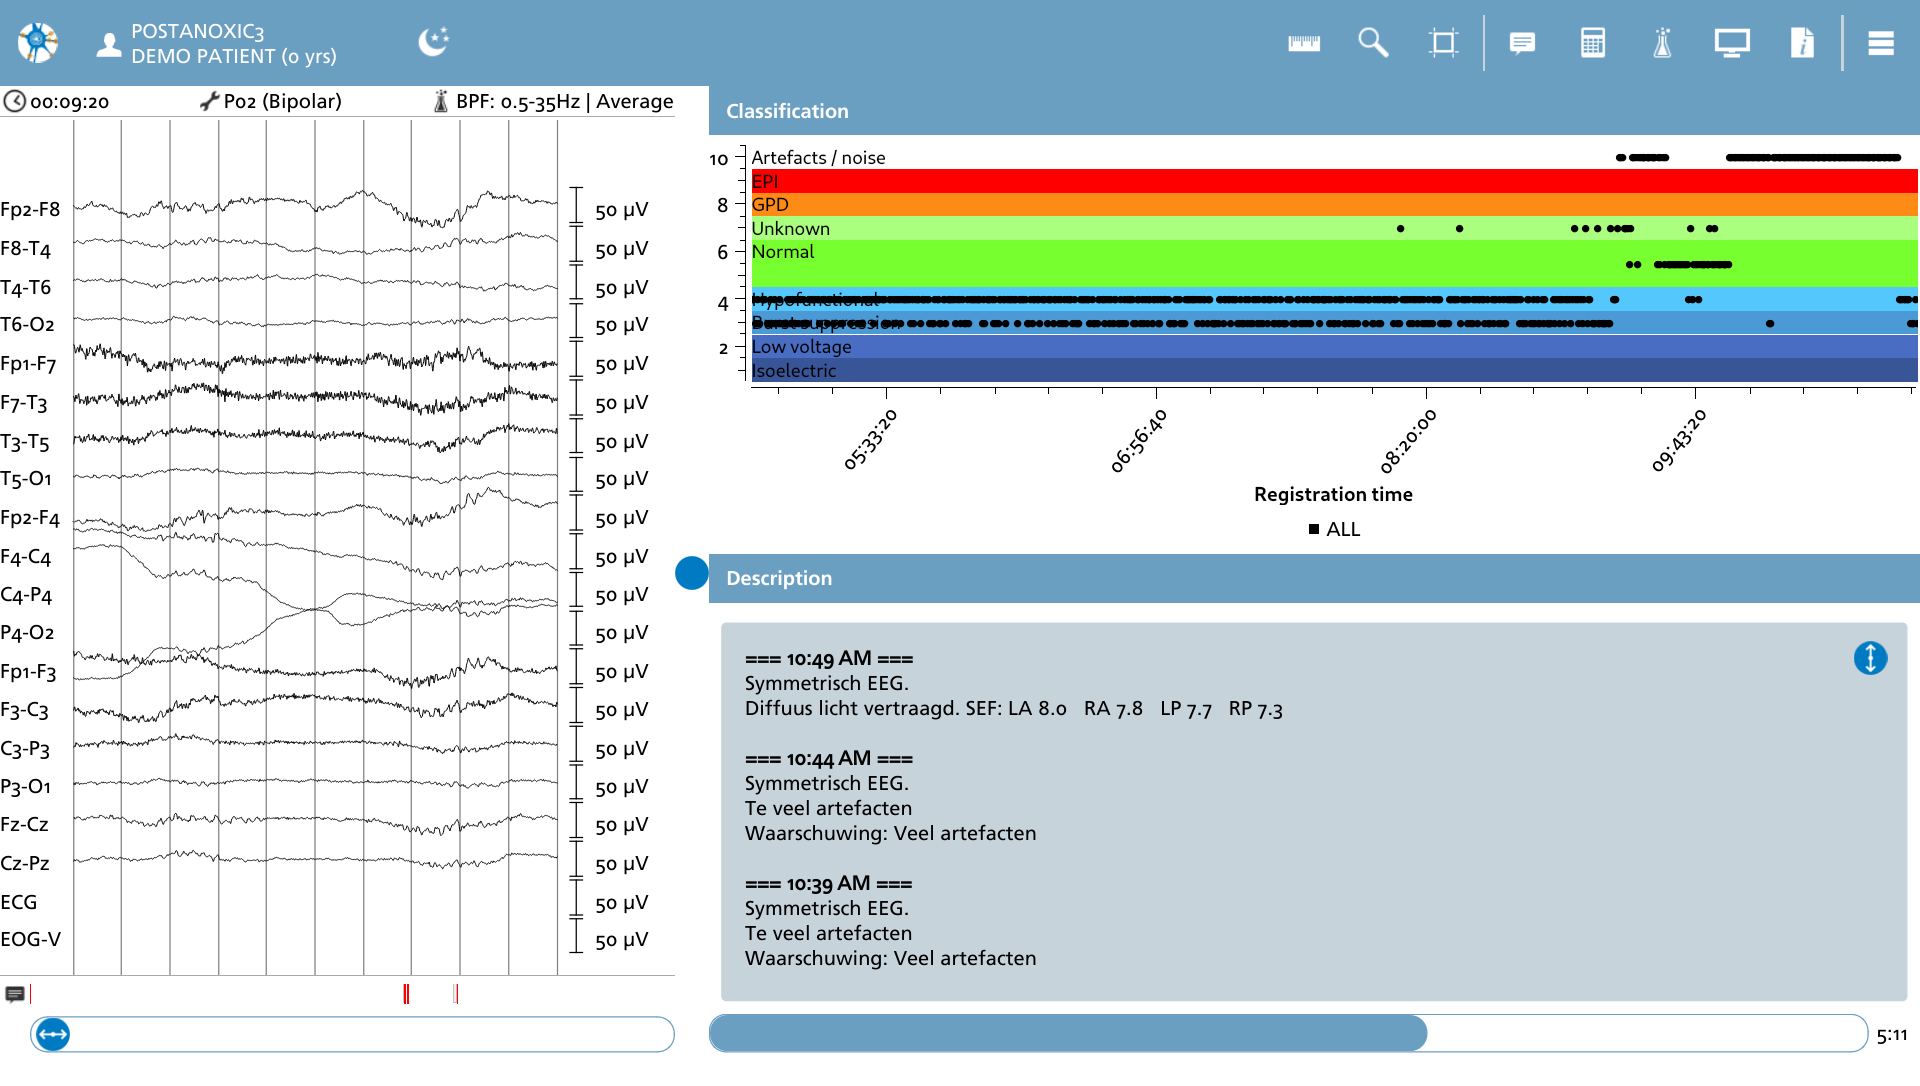
ICU Signal Assistant (ISA)
The ICU Signal Assistant serves as a valuable tool in the identification of specific EEG patterns and provides a concise overview of changes in these patterns over time. This analysis involves the extraction of 30 seconds of data from a 10-20 bipolar montage and employs a classic machine learning-based model that relies on predefined EEG features for its calculations. Ultimately, the analysis categorizes the EEG into nine distinct classifications:
-
Iso-electric
-
Low voltage
-
Burst suppression patterns
-
Hypofunctional
-
Normal
-
Unknown
-
Generalized periodic discharges
-
Epileptic activity
-
Artefacts / noise
The results are visualized within a six-hour time window, accompanied by a brief description that summarizes the EEG data from the preceding five minutes.

Interictal Epileptiform Discharge (IED) detector
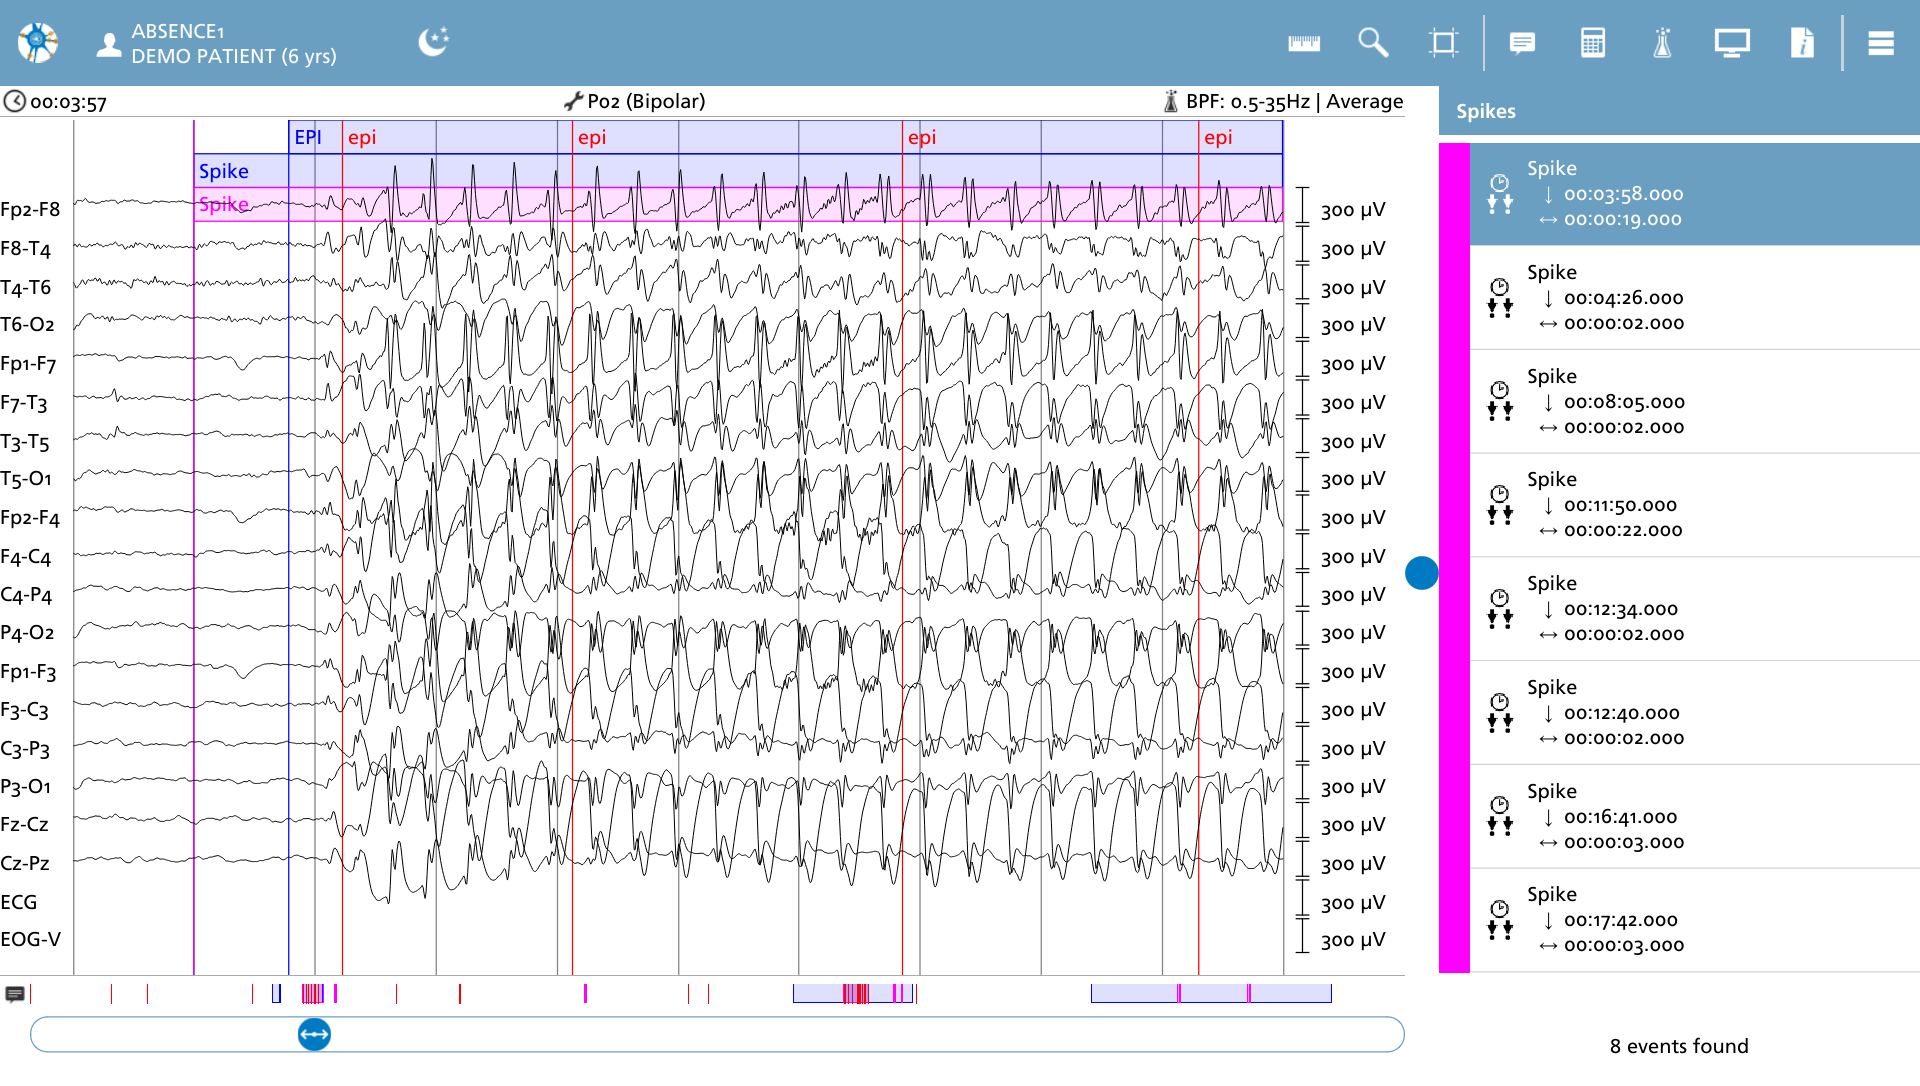
The Interictal Epileptiform Discharge (IED) detector employs a deep learning model to identify potential discharge occurrences within electroencephalogram (EEG) data. The analysis involves segments of 2 seconds taken from 10-20 bipolar montaged EEG recordings, during which the model calculates the probability of discharges. Results that exceed a predetermined threshold are presented in a list of annotations labeled ‘Spike’. These annotations can be selected to align the EEG data with the corresponding locations of the detected events. Additionally, the results provide the total number of events identified during this measurement.
Spectral Edge Frequency (SEF95)
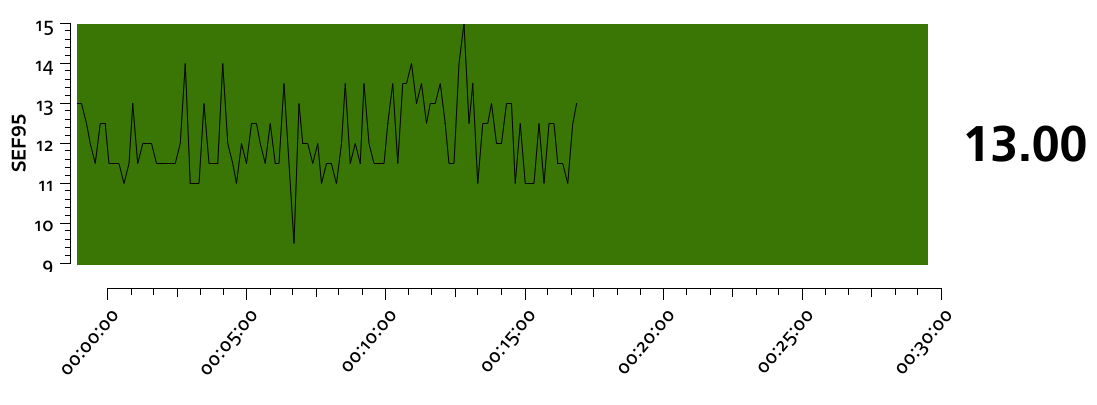
The spectral edge frequency (SEF) is a significant metric that denotes the frequency below which 95 percent of the total power of a specific signal is concentrated. In the context of electroencephalography (EEG), a 10-second segment of data is analyzed within the frequency range of 0.5 Hz to 25 Hz. SEF is particularly recognized as a valuable measure in EEG monitoring, where it has been employed to estimate the depth of anesthesia and various stages of sleep. The results of this analysis are typically represented in a trend chart every 10 seconds.
Spectrogram
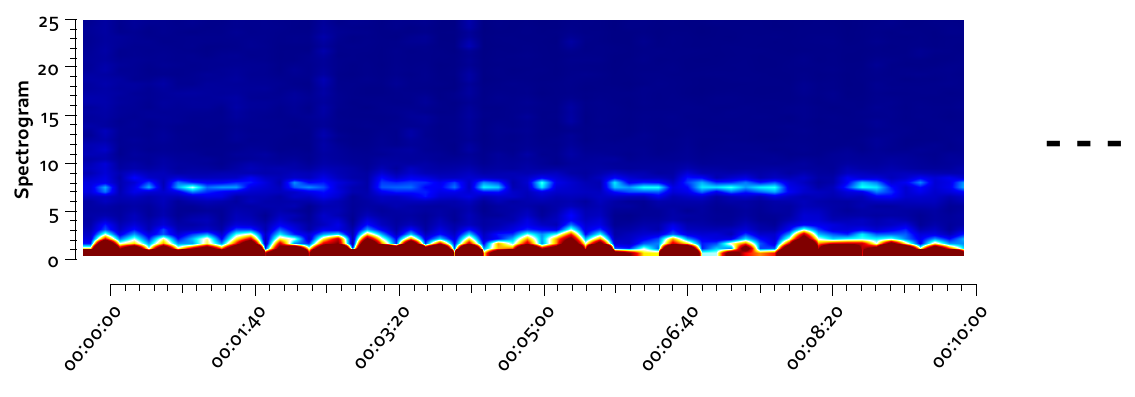
The spectrogram analysis is a method used to calculate the power density spectrum within the frequency range of 0.5 Hz to 25 Hz. This analysis produces a visual representation of the power density, which is displayed using a heat map. The resulting output is then presented as a trend, allowing for a comprehensive understanding of the frequency components over time.
Spectrum Analysis
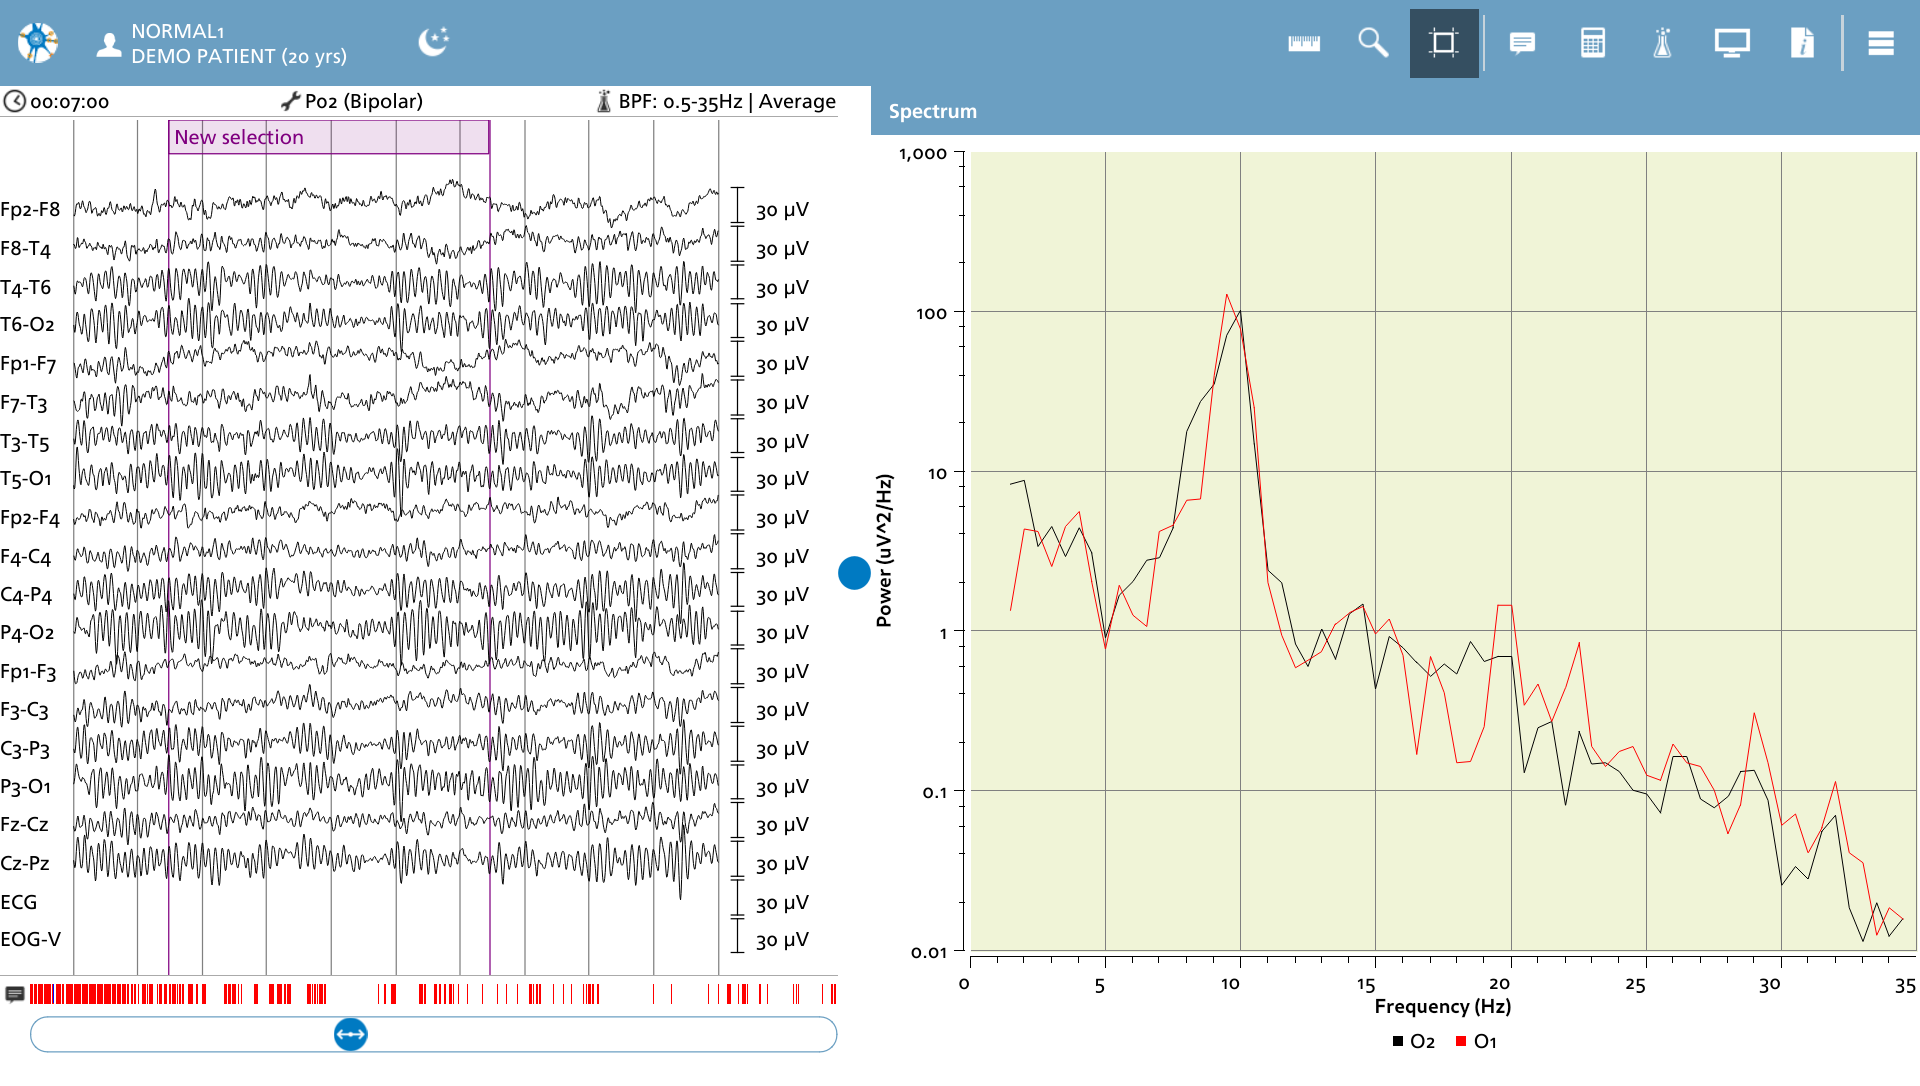
The spectrum analysis involves the calculation of the power density spectrum within the frequency range of 0.5 Hz to 35 Hz. It is essential to utilize the selection tool to define the interval for this analysis, with a minimum recommended interval of 2 seconds. The results of this analysis are subsequently represented in a dedicated output element for further examination.