
Overview
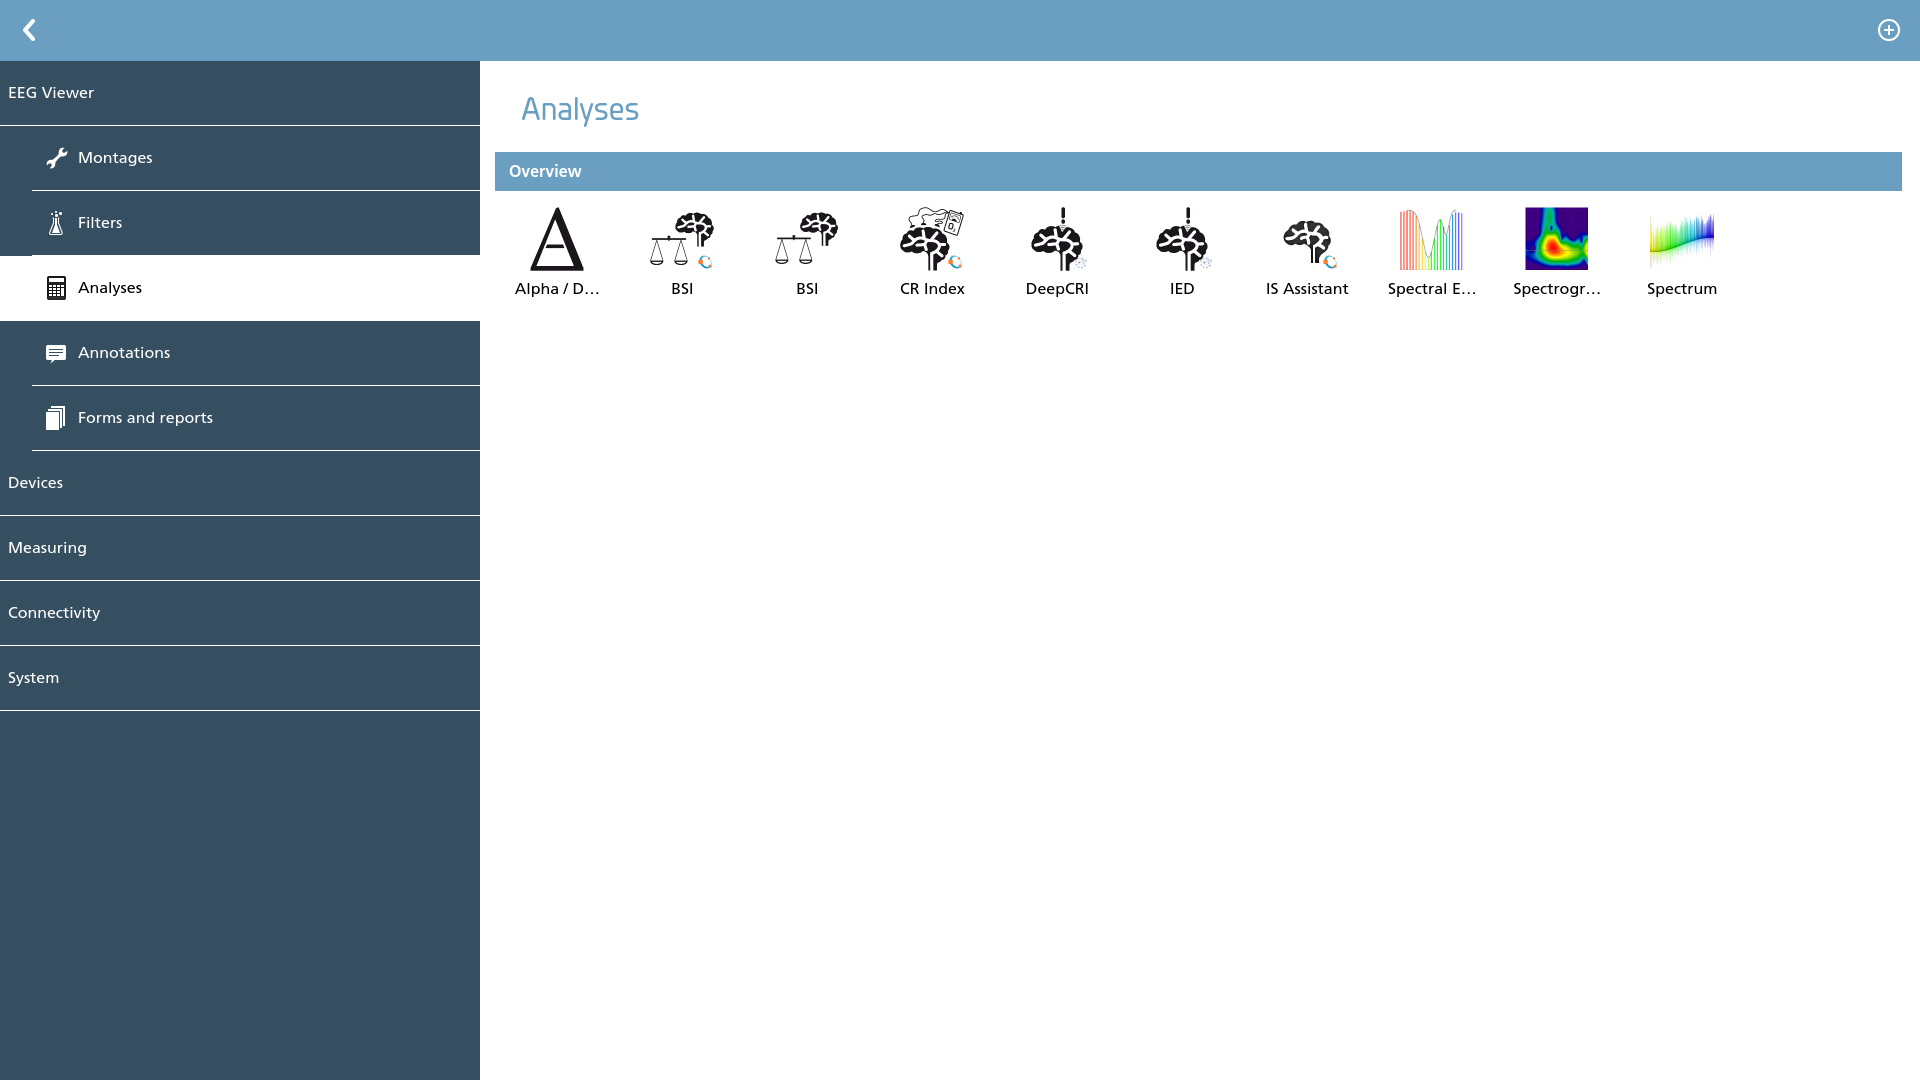
Here we define the analyses that are intended to be accessible. NeuroCenter® EEG is equipped with various built-in analyses, and depending on the type of license you possess, additional analyses can be accessed through the online EEG analysis platform. Comprehensive information regarding these analyses is available in the Operating Instructions; however, this section emphasizes the configuration process.
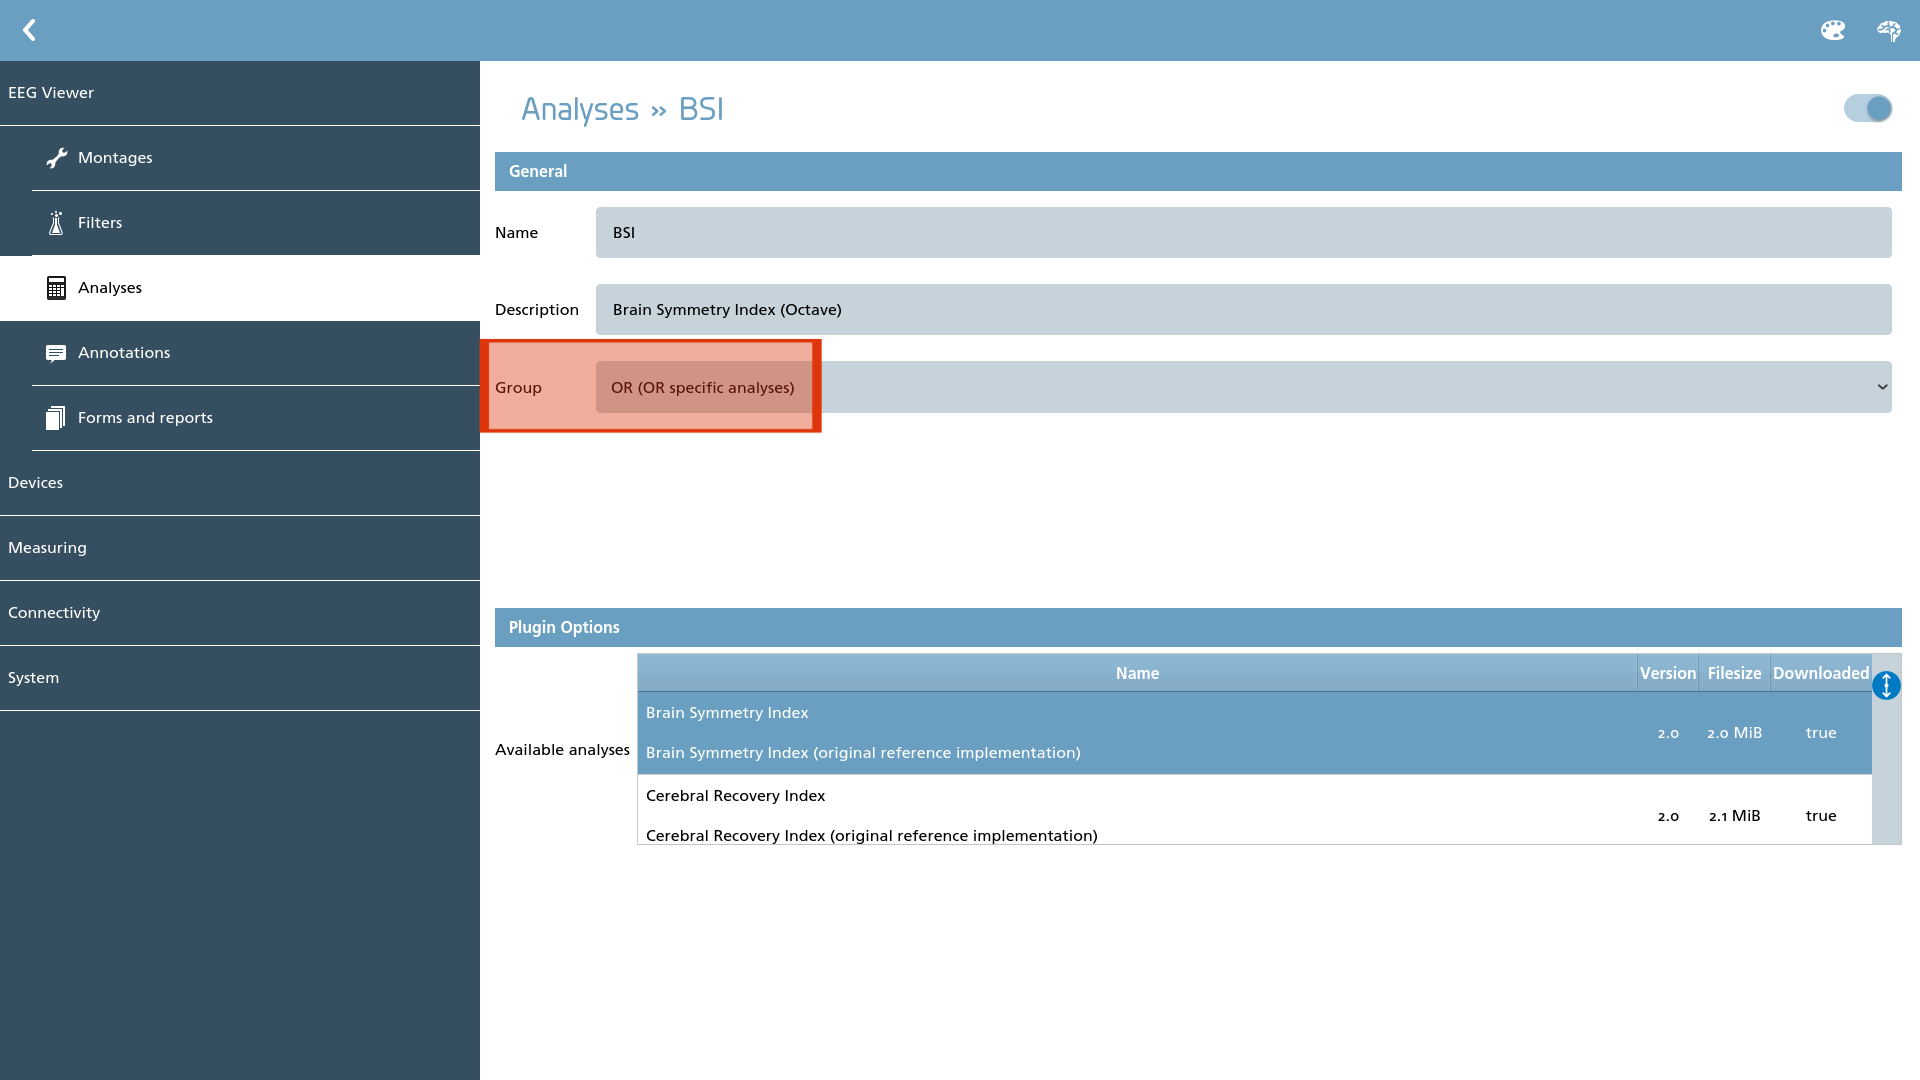
When adding a new analysis, it is essential that it belongs to a designated group. These groups categorize various types of analyses, which are subsequently displayed together in the analysis selection overlay within the viewer. It is important to note that these groups are predefined and cannot be modified. The available groups include:
-
ICU (ICU specific analyses)
-
OR (OR specific analyses)
-
Spectrum Toolbox (FFT based analyses)
-
Epilepsy (Epilepsy related analyses)
-
Advanced (Misc advanced analyses)
-
Miscellaneous (Other analyses)
-
User (User defined analyses)
Actions
The following actions are available for each analysis:
|
Icon |
Description |
|---|---|

|
Display layout Edit the analysis output layout |

|
Input signals Define custom input signals |
Display layout
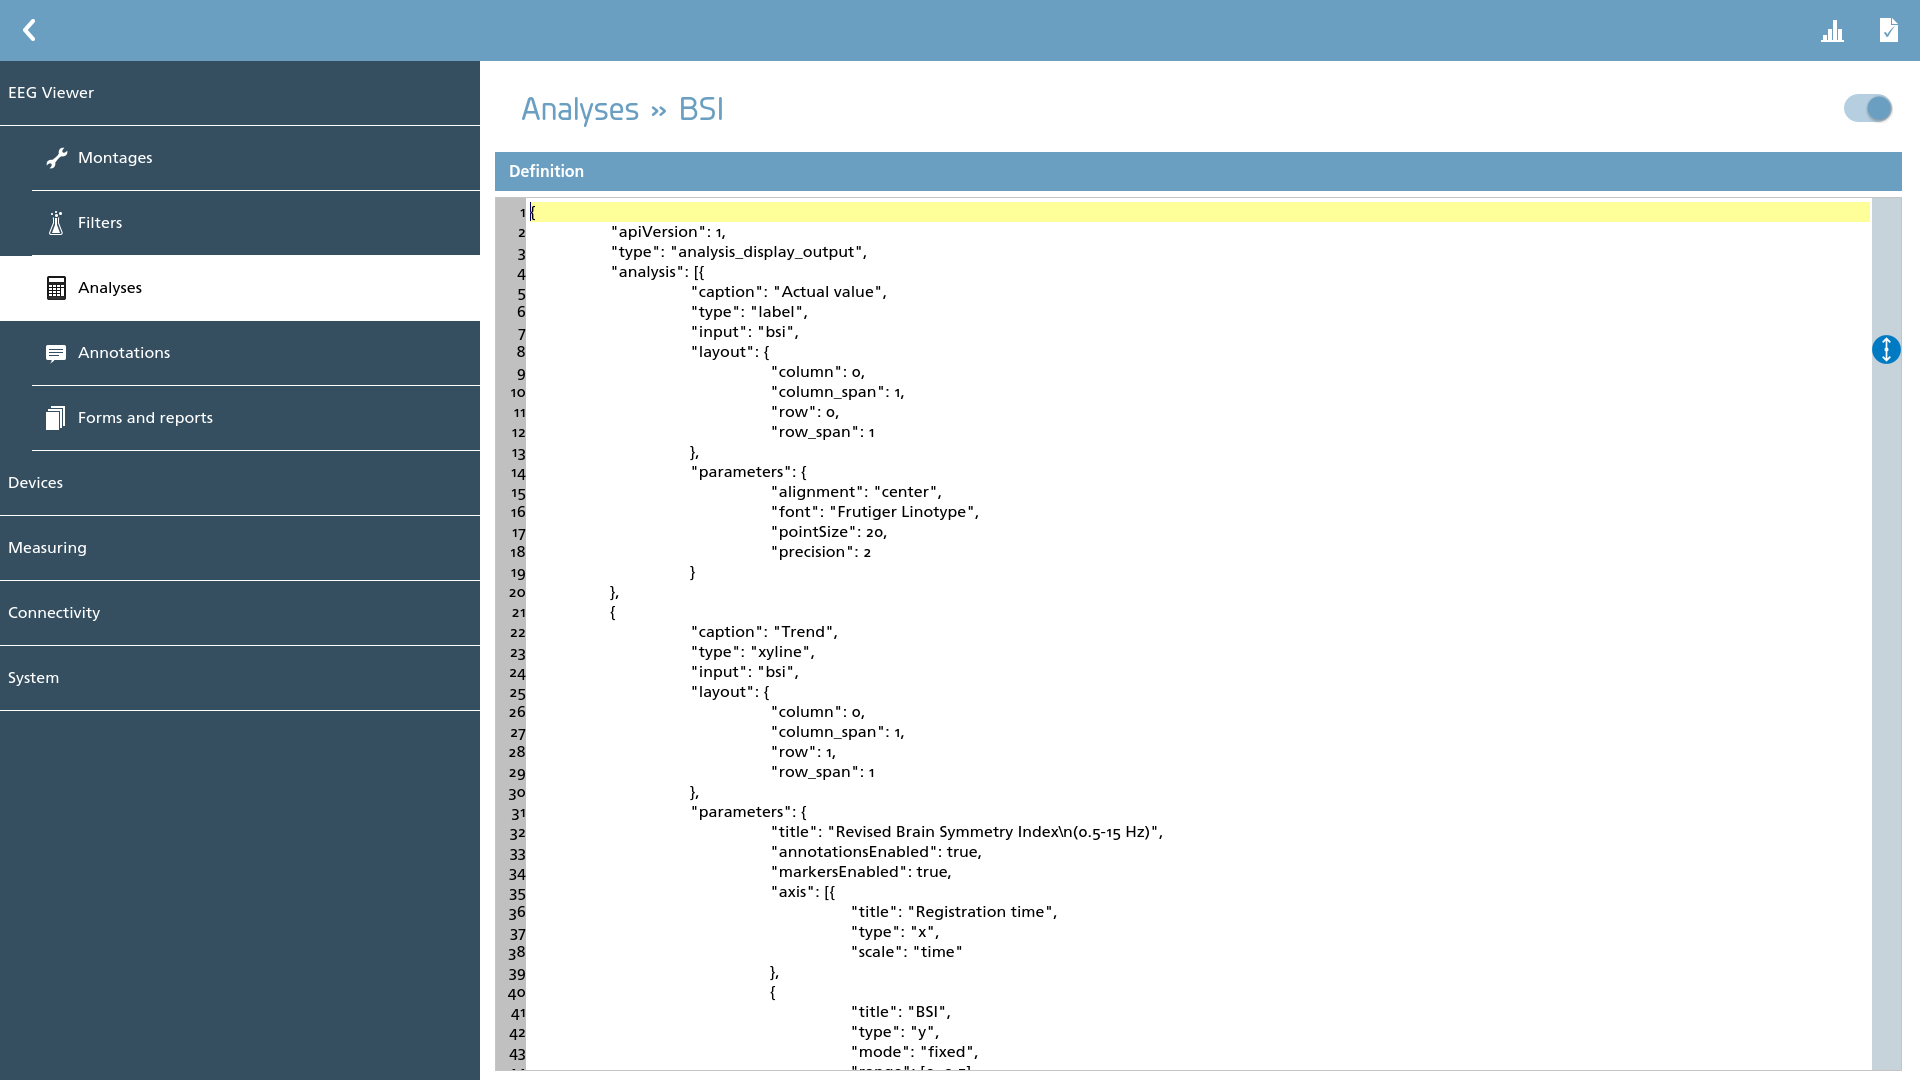
Within this section, the elements of the analysis output designated for display purposes can be defined. Each analysis possesses a unique preset, which can be imported for the purpose of editing. The process of customizing a preset is generally executed by importing the original preset into the JSON editor, where modifications can be made. The following actions are available to facilitate this process:
|
Icon |
Description |
|---|---|

|
Import Import the preset layout from the analysis. This action will overwrite any existing custom layouts. |

|
Check Check the JSON definition for errors. |
In the absence of a JSON definition, the analysis plugin will revert to utilizing the default preset layout. This default layout is adequate for most scenarios.
The JSON definition comprises a foundational structure that includes both analysis and trend arrays, with only one of each being required. The analysis array specifies the output elements displayed in a standalone analysis element, while the trends array outlines the outputs that are incorporated into trend views.
{
	"apiVersion": 1,
	"type": "analysis_display_output",
	"analysis": [
	{
		...
	},
	{
		...
	}],
	"trend": [
	{
		...
	},
	{
		...
	}]
}
JSON root object
The definitions of the JSON keys within the root element are as follows:
|
Name |
Possible values |
Required |
Description |
|---|---|---|---|
|
apiVersion |
1 |
X |
The API version for this layout |
|
type |
analysis_display_output |
X |
The type of JSON defined |
|
analysis |
array |
X [1] |
Array of elements for stand alone analysis output |
|
trend |
array |
X [1] |
Array of trends, added to a trend view |
[1] Only one of each is required
JSON analysis or trend object
Each analysis or trend element has the following structure.
"analysis": [
{
	"caption": "Actual value",
	"type": "label",
	"input": "bsi",
	"layout":
	{
        ...
	},
	"parameters":
	{
		...
	},
	"requirements": [
	{
		...
	}]
}]
The keys in each analysis or trend element are defined as follows:
|
Name |
Possible values |
Types |
Required |
Description |
|---|---|---|---|---|
|
caption |
text |
analysis |
- |
Set a caption for this element. Captions are typically displayed above the element to provide context or additional information. |
|
type |
xyline | xyarea | spectrogram | topoplot | text | annotationlist |
All |
X |
The type of analysis element. |
|
input |
text | array |
All |
X |
Defines the output array name of the analysis, which functions as the input for displaying results. In instances where multiple inputs are provided, it is advisable to utilize an array consisting of text keys. |
|
layout |
object |
analysis |
X |
Defines the position of the result element on the virtual grid. For further understanding, please refer to the table below for the relevant keys. |
|
parameters |
object |
All |
X |
Defines the appearance and behavior of the element. For a comprehensive understanding, please refer to the table below for the keys. |
|
requirements |
array of objects |
trend |
- |
Defines additional requirements for the trend view, which encompasses conditional backgrounds. For detailed information, please refer to the table below for the keys. |
|
unit |
text |
trend |
X |
Defines the unit in which the values of the trend are measured. This label is prominently displayed along the y-axis of the trend, providing essential context for interpreting the data represented. |
JSON layout object
The keys in the layout object are defined as follows:
|
Name |
Possible values |
Required |
Description |
|---|---|---|---|
|
row |
number |
X |
Defines the row in the virtual grid for this element. |
|
column |
number |
X |
Defines the column in the virtual grid for this element. |
|
row_span |
number |
X |
Defines the row span in the virtual grid for this element. |
|
column_span |
number |
X |
Defines the column span in the virtual grid for this element. |
JSON parameters object
The keys in the parameters object are defined as follows:
|
Name |
Possible values |
Types |
Required |
Description |
|---|---|---|---|---|
|
axis |
array of objects |
xyline | xyarea |
X |
Configuring the axes for display is an essential aspect of data visualization. For detailed guidance, please refer to the table below, which outlines the relevant keys. |
|
background |
object |
xyline | xyarea |
- |
Configuring a background involves utilizing specific keys as outlined in the table below. |
|
lineWidth |
number |
xyline | xyarea |
- |
Configuring the line width of graphs is an important aspect of data visualization. The default setting for line width is 1, which can be adjusted to enhance the clarity and visual appeal of the graphs. |
|
annotationsEnabled |
true | false |
xyline | xyarea |
- |
Displays file annotation markings when enabled in xyline and xyarea types. The default setting for this feature is false. |
|
markersEnabled |
true | false |
xyline | xyarea | spectrogram |
- |
Displays marker symbols if enabled in xyline and xyarea types, and it also displays contour lines in spectrogram types. The default setting for this feature is false. |
|
gridEnabled |
true | false |
xyline | xyarea |
- |
Displays a helper grid, which is set to false by default. |
|
navigatorEnabled |
true | false |
xyline | xyarea |
- |
If enabled, the graph functions as a navigator for EEG files. This functionality allows for the repositioning of the EEG file when the graph is clicked. The default setting for this feature is false. |
JSON axis object
The keys in the axis object are defined as follows:
|
Name |
Possible values |
Required |
Description |
|---|---|---|---|
|
type |
x | y | z |
X |
Indicating which axis is being configured is a crucial step in data analysis. For analysis elements, it is essential to define both an x-axis and a y-axis to accurately represent the data. In contrast, for trend elements, only a y-axis is necessary, as the management of the x-axis is handled by the trend view itself. Additionally, a z-axis is required exclusively for spectrogram elements, which adds a third dimension to the data representation. |
|
title |
text |
- |
The title to display along the axis. |
|
mode |
autoscale | fixed | window |
- |
Configures the behavior of axis scaling. When a fixed mode is selected, the range should consist of an array containing minimum and maximum values. Conversely, when window mode is chosen, the range indicates the length in seconds of the moving window. It is important to note that window mode is exclusively available for the x-axis type. |
|
range |
number or array |
- |
This key is utilized in conjunction with fixed and window mode axes. It is essential to define an array that specifies a minimum and a maximum value for fixed mode, while a single value is designated for window mode. When applied to the x-axis type, the value is expressed in seconds. |
|
scale |
numeric | time | hide |
X |
Defines the scale type utilized on the scale. It is important to note that time is exclusively available for the x-axis type. |
|
logScale |
true | false |
- |
The functionality allows for the activation or deactivation of a logarithmic scale on the axis. |
JSON background object
The keys in the background object are defined as follows:
|
Name |
Possible values |
Types |
Required |
Description |
|---|---|---|---|---|
|
type |
rectangle | text | polynome_2nd_order | exponential |
- |
X |
This key delineates the type of background utilized in graphical representations. The employment of a fixed rectangle is the most prevalent method, serving to indicate boundaries and threshold sections within the graph, thereby aiding the user in interpretation. Text elements are employed to present information at specific locations within the graphs. Furthermore, more sophisticated boundaries can be constructed using polynomial and exponential formulas. |
|
range |
object |
rectangle |
- |
Defines the x and y ranges to display this rectangle. In instances where no range is provided (partially) or elements within the specified range are defined as -1, it is assumed that the rectangle should extend to its maximum position in that direction. The example demonstrates a range that is represented starting from 0.5 and extending upwards on the y-axis, while encompassing the entirety of the x-axis. It is noteworthy that the key for the x-axis may have been excluded in this particular illustration. JSON
|
|
formula |
|
polynome_2nd_order | exponential |
X |
Formula defines the methodology for establishing boundaries based on mathematical formulas. Second-order polynomial formulas are structured in the following manner, where the formula reads as ax² + bx + c: JSON
For exponential formulas, the structural definition can be articulated as follows. The formula is represented as Euler's exponent of -k(x - offset) within a specified range: JSON
|
|
boundary |
number |
polynome_2nd_order | exponential |
- |
Defines the upper or lower y-value that determines the extent of the background element. The background element is filled with color between the boundary level and the outcome of the formula applied to the section. |
|
fillColor |
text |
rectangle | polynome_2nd_order | exponential |
- |
Defines the color to use for this specific background element. Colors can be represented in two primary formats: as readable text names (such as 'red' or 'blue') or as specific hexadecimal codes (for example, '#ff8b17'). |
|
description |
text |
rectangle |
- |
Inserts a textual description at the top-left most position within the background element. |
JSON requirements object
The keys in the requirements object are defined as follows:
|
Name |
Possible values |
Required |
Description |
|---|---|---|---|
|
mode |
adjustOffset |
X |
With the incorporation of requirements to trend output results, it becomes possible to alter the visual presentation in accordance with particular input conditions. The mode parameter specifies the action to be executed. Utilizing adjustOffset allows for the modification of the offset of background elements, which can be influenced by factors such as an annotation. |
|
type |
annotation |
X |
Defines the type of requirement. Currently, only the annotation type is supported, which facilitates the use of an annotation to fulfill specific criteria. |
|
payload |
text |
X |
This key delineates the remainder of the annotation once the trigger condition has been satisfied. Currently, it should be populated with a time format, such as hh:mm, to facilitate the processing of timestamps. |
|
triggerText |
text |
X |
This key serves to define the text fragment within an annotation, which is essential for triggering this specific requirement. |
|
warning |
text |
X |
The text to display when this requirement is not met serves as a crucial indicator. It is important to recognize that this item is translatable, which highlights its significance in various contexts. |
Translatable items can be localized by appending an underscore (_), the appropriate ISO-639 language code, another underscore (_), and the ISO-3166 country code to the specific key. For instance, to provide a warning in Dutch, one would simply add the key: warning_nl_NL within the same object.
Input signals
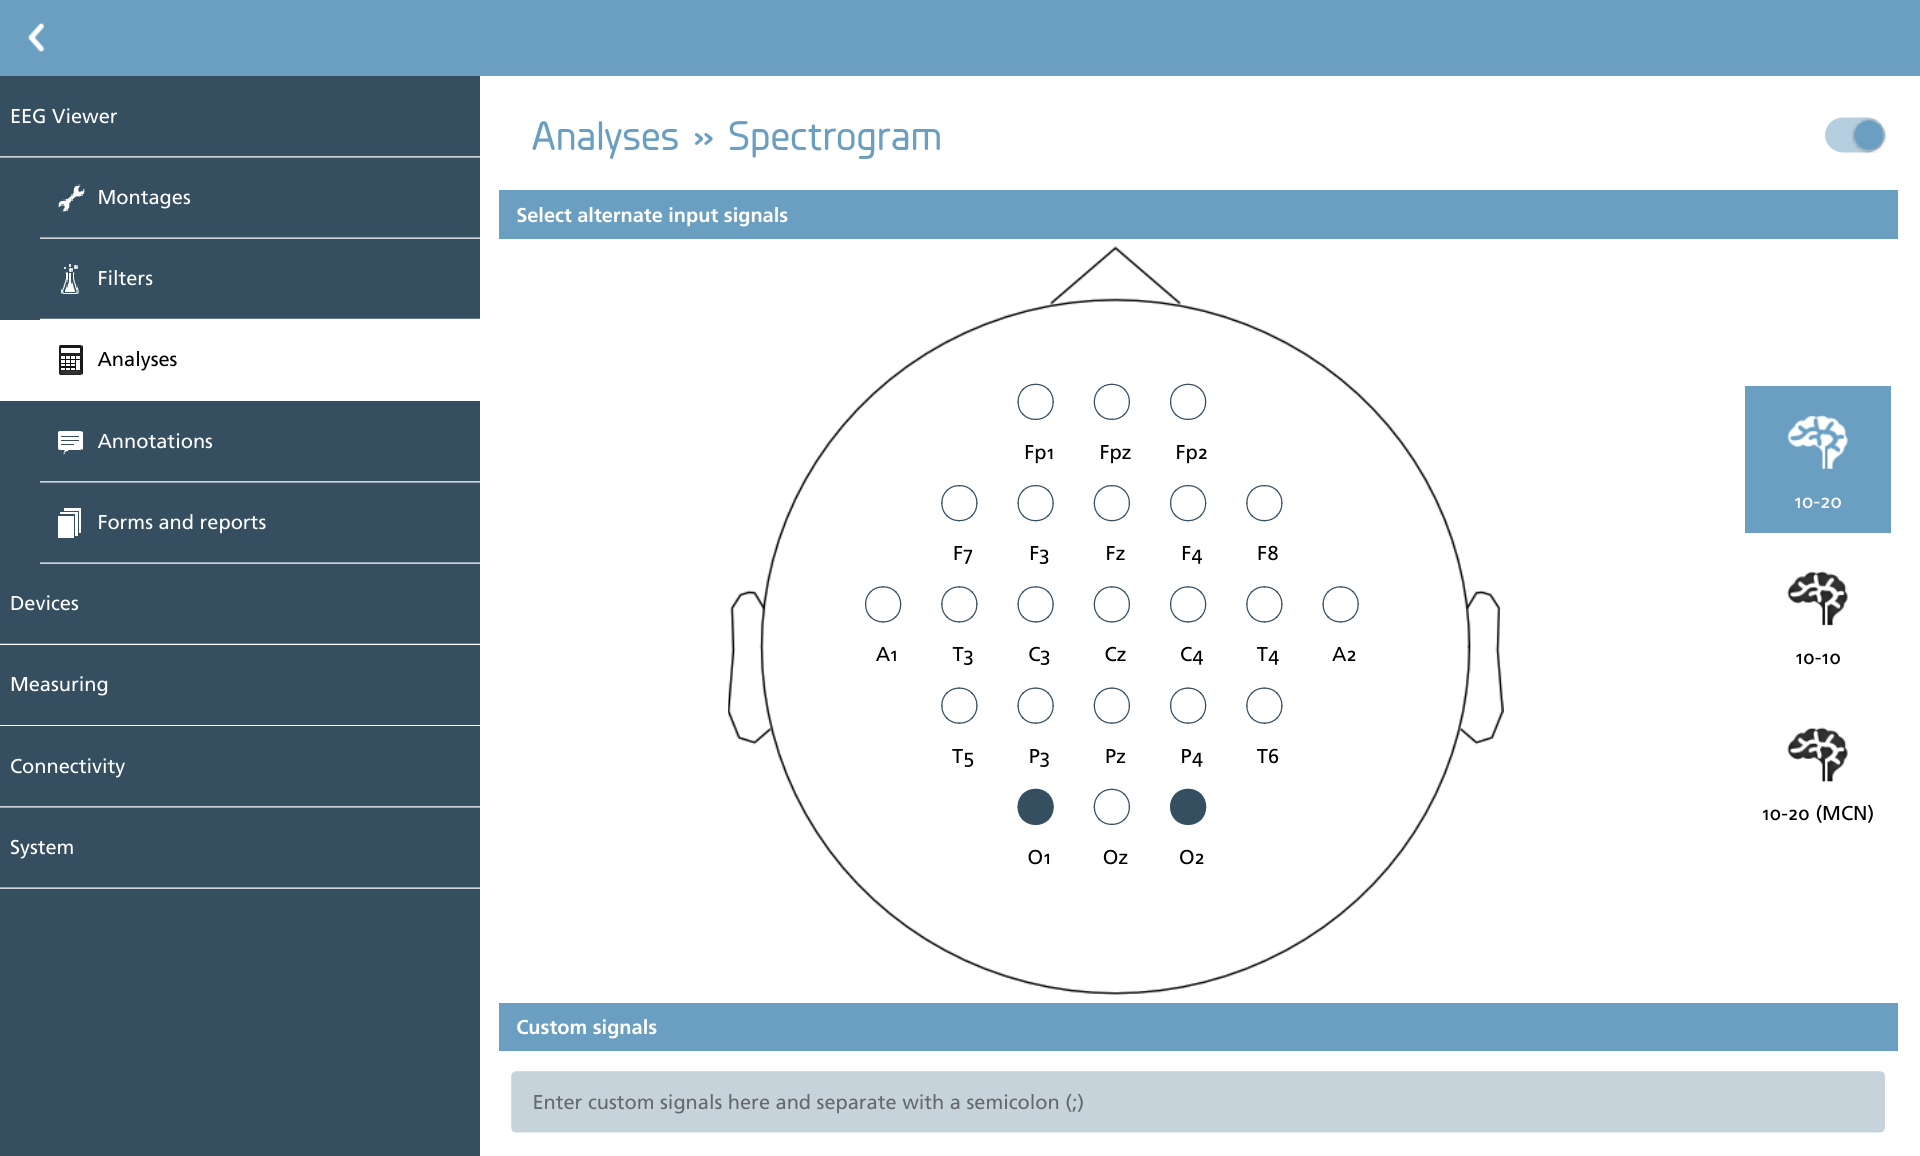
By default, all input signals available in the file are transmitted to the selected analysis. In the absence of specific modifications, these signals are filtered using electrode labels from the 10-20 and 10-20 MCN systems. If it is not desirable to transmit all signals, or if there is a need to include custom signals for analysis, this interface provides the necessary options. Here, various signals can be selected from one of the three head-layout positions, and custom signals can be entered in the designated custom signal input field. It is important to utilize a semicolon-separated list for custom signals. To revert to the default functionality, which allows the analysis to manage the signals autonomously, one should deselect all electrodes from the head layout and clear the custom signals input field.
Plugins
The plugins delineate the available analyses. Certain plugins necessitate additional configuration, while those that do not require specific configuration are not discussed further in this context. Below is the current set of plugins along with a brief description.
|
Icon |
Description |
Configurable |
|---|---|---|

|
Alpha / Delta ratio Calculates alpha / delta ratio |
No |

|
BSI Calculates Brain Symmetry Index (BSI) |
No |

|
eeg.services Offloads data for remote calculation in the eeg.services Cloud Analysis Framework |
Yes |
|
DLClassify Calculates Deep Learning based analyses |
Yes |

|
Octave Calculates Octave based analyses |
Yes |
|
Spectral Edge Calculates spectral edge frequency |
No |
|
Spectrogram Calculates spectrogram |
No |

|
Spectrum Calculates power spectrum |
No |
eeg.services Cloud Analysis Framework
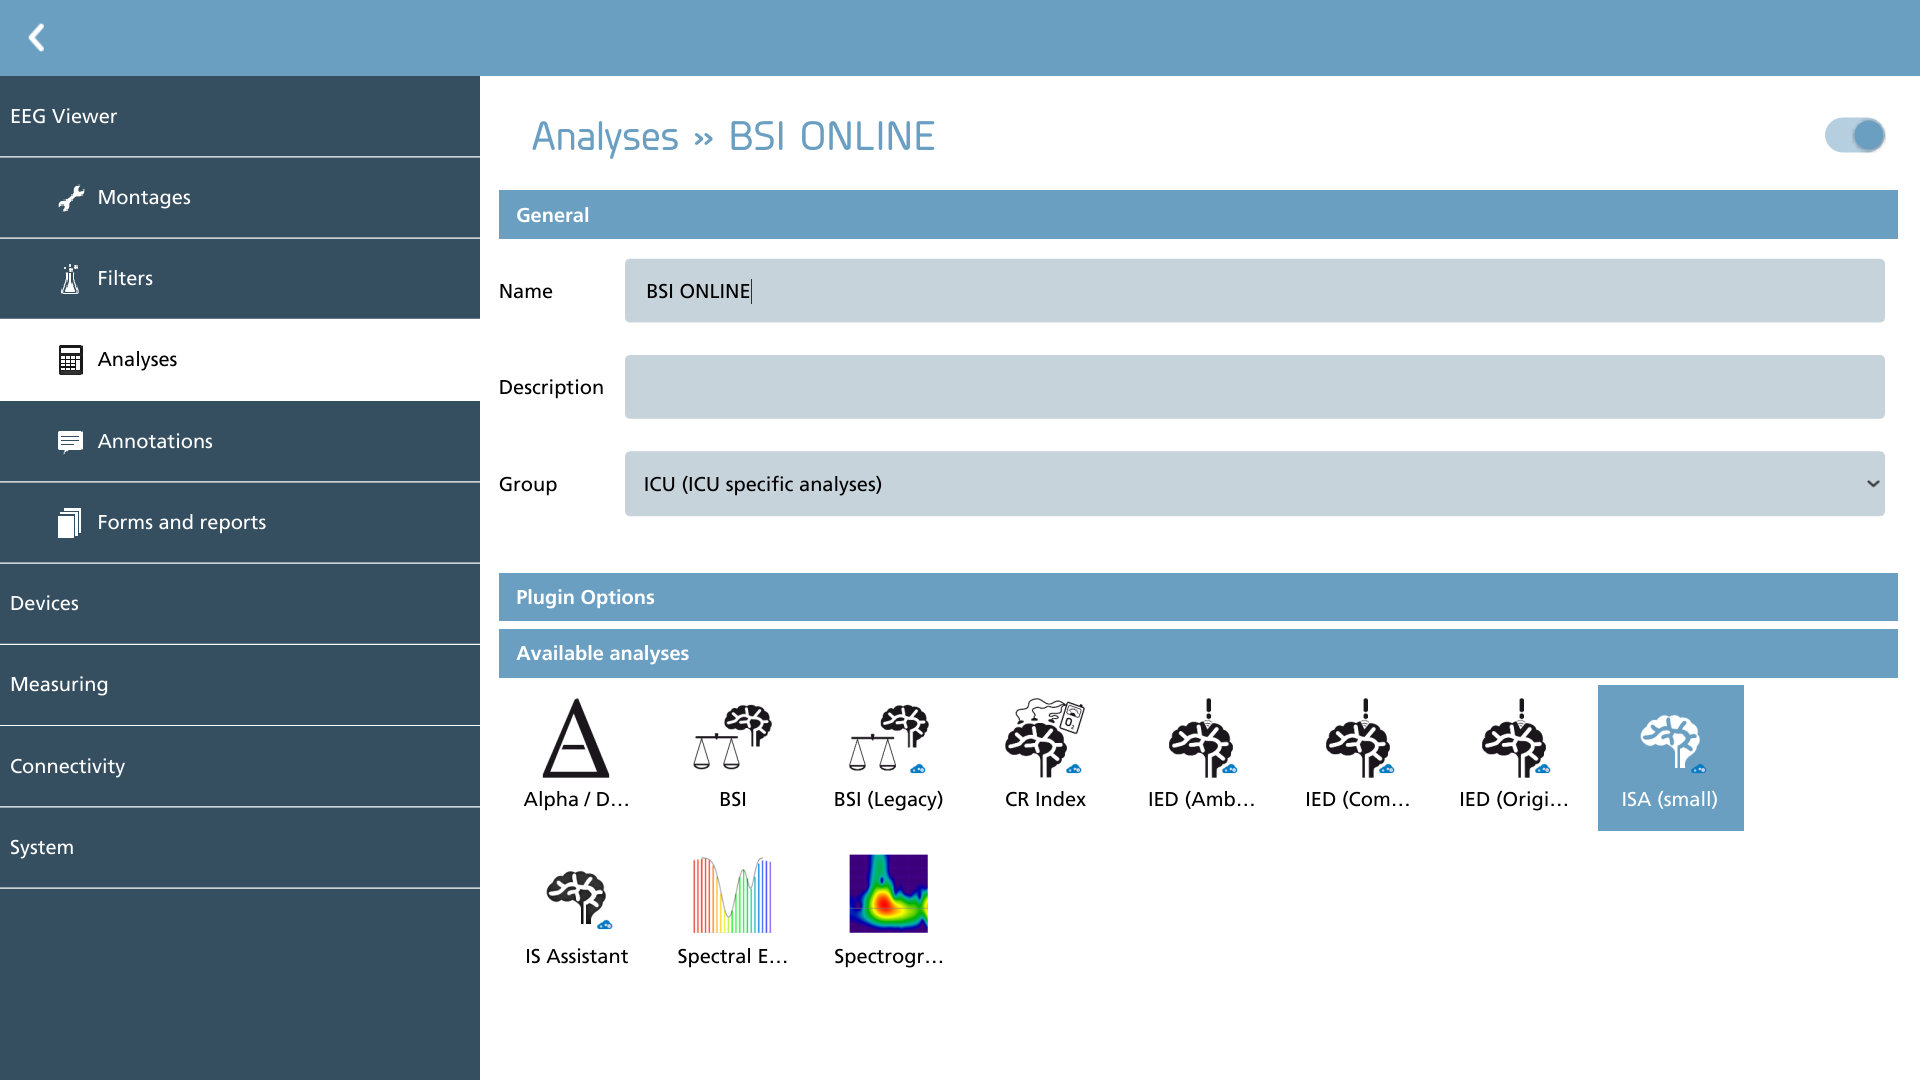
The eeg.services Cloud Analysis Framework facilitates the offloading of EEG data for remote analysis in a cloud environment. The browser-based client of NeuroCenter® EEG significantly depends on this plugin for conducting more advanced analyses, although it is also beneficial for desktop-based clients. This is particularly advantageous when utilizing data from cloud storage, as it eliminates the need for extensive uploads and downloads of large data sets; the plugin can directly access the storage.
It is important to note that no patient data is transmitted to the eeg.services Cloud Analysis Framework; only raw EEG traces are involved. Additionally, no data is permanently stored on the analysis server, and all raw EEG data is deleted following the completion of the analysis or after a predetermined period if the analysis fails.
To utilize this plugin, please select one of the available analyses from the list. The icon will display a small overlay of the eeg.services Cloud Analysis Framework icon in the bottom right corner, indicating that this plugin is in use.
|
Icon |
Description |
|---|---|

|
BSI (Legacy) Calculates the original Brain Symmetry Index (BSI) |

|
CR Index Calculates the Cerebral Recovery Index (CRI) |

|
IED Calculates inter-ictal epileptiform discharges (IED) using the ambulatory / original / combined model |

|
IS Assistant Calculates ICU Signal Assistant signal classification analysis. |
DLClassify
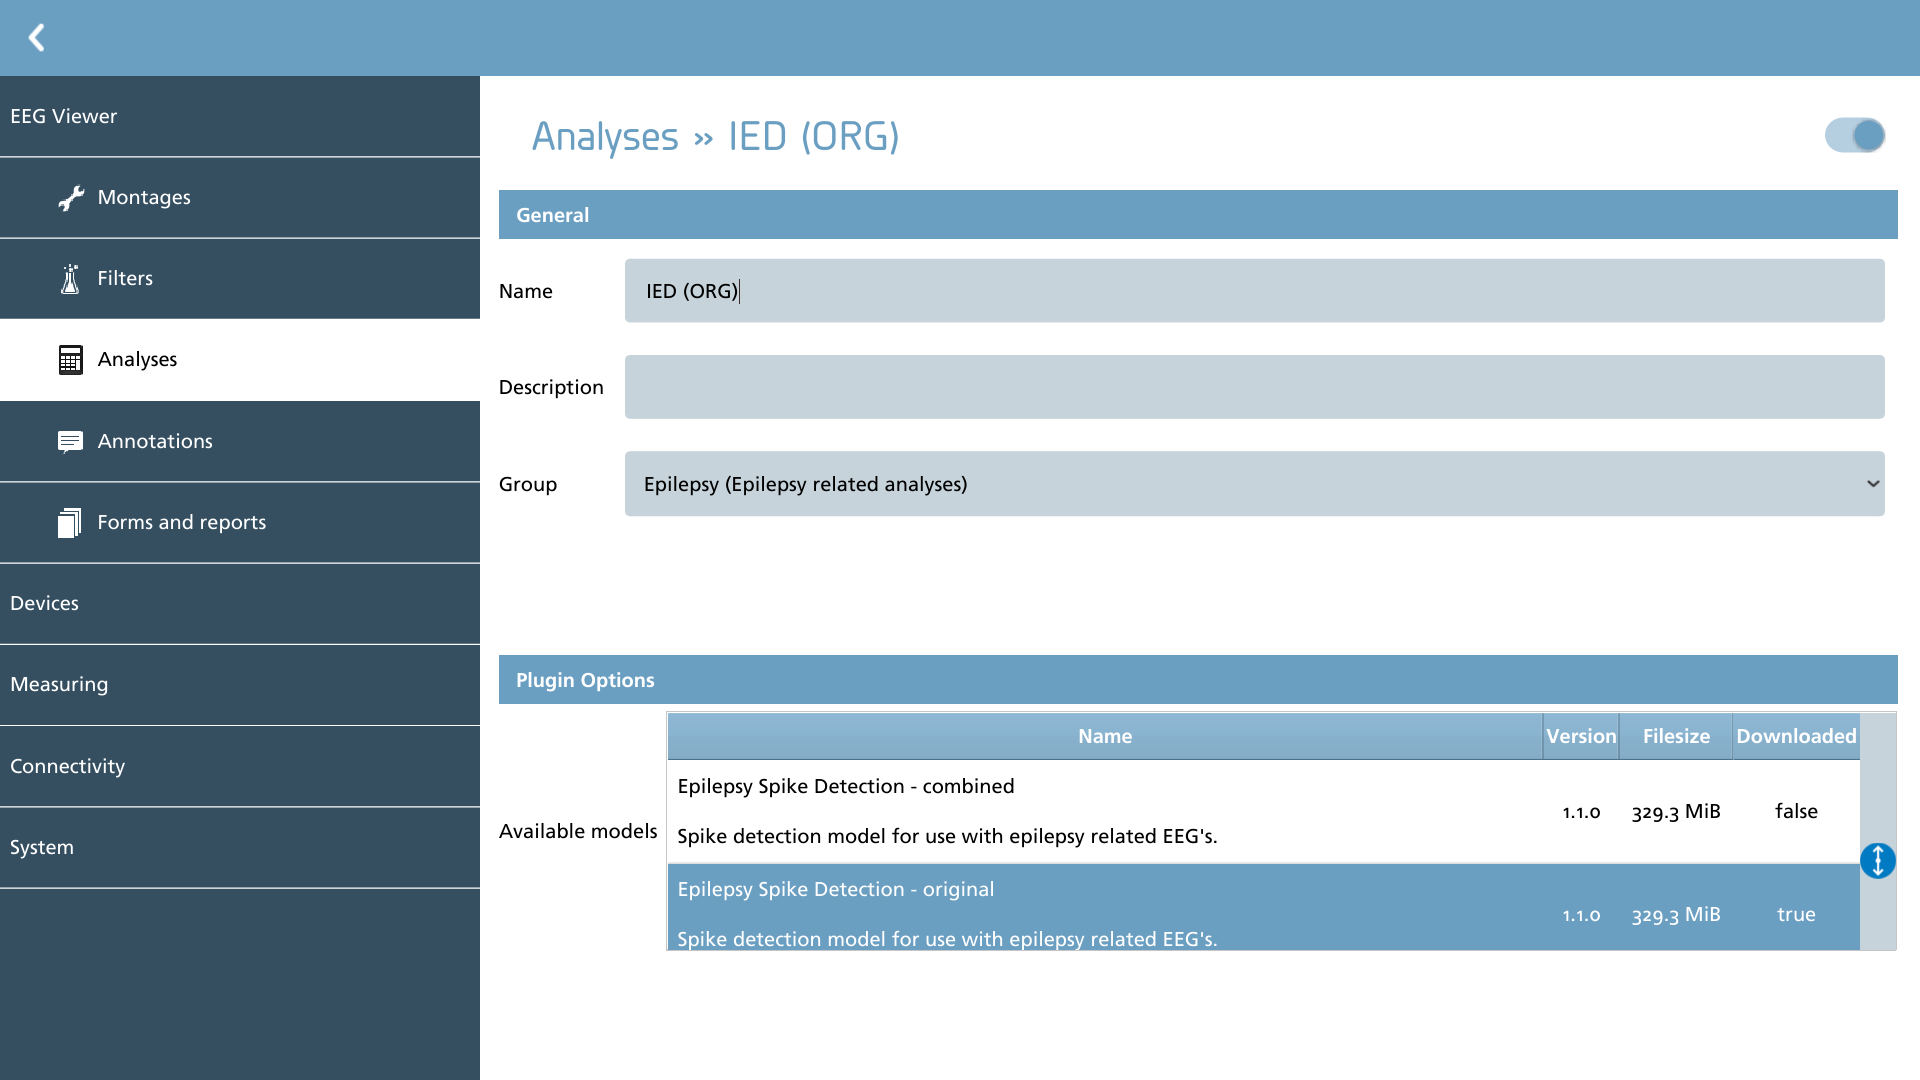
Configuration of the DLClassify plugin necessitates the selection of a model for utilization. These models can be accessed from a centralized repository and must be downloaded prior to their application. During the configuration of these plugin types, the ‘Downloaded’ column serves as an indicator of whether the model is already available on the system. If the model is not present, it will be automatically downloaded upon exiting this interface.
Please select one of the available models from the list. Once the download is complete, the icon associated with the model will replace the standard DLClassify icon. This new icon will feature a small overlay of the DLClassify icon in the bottom right corner, signifying that the plugin is in use.
|
Icon |
Description |
|---|---|

|
DeepCRI Cerebral Recovery Index (CRI) models for predicting neurological outcome at 24h after cardiac arrest. |
|
|
DeepIED Interictal Electric Discharge detection model for use with epilepsy related EEG's. |
To utilize the DLClassify plugin effectively, it is essential that the underlying hardware is compatible with the AVX instruction set. Insufficient support for this instruction set may result in NeuroCenter® EEG failing to initiate or experiencing crashes during analyses that utilize DLClassify. It is advisable to ensure that this instruction set is enabled, particularly in environments where virtualization is employed.
Octave
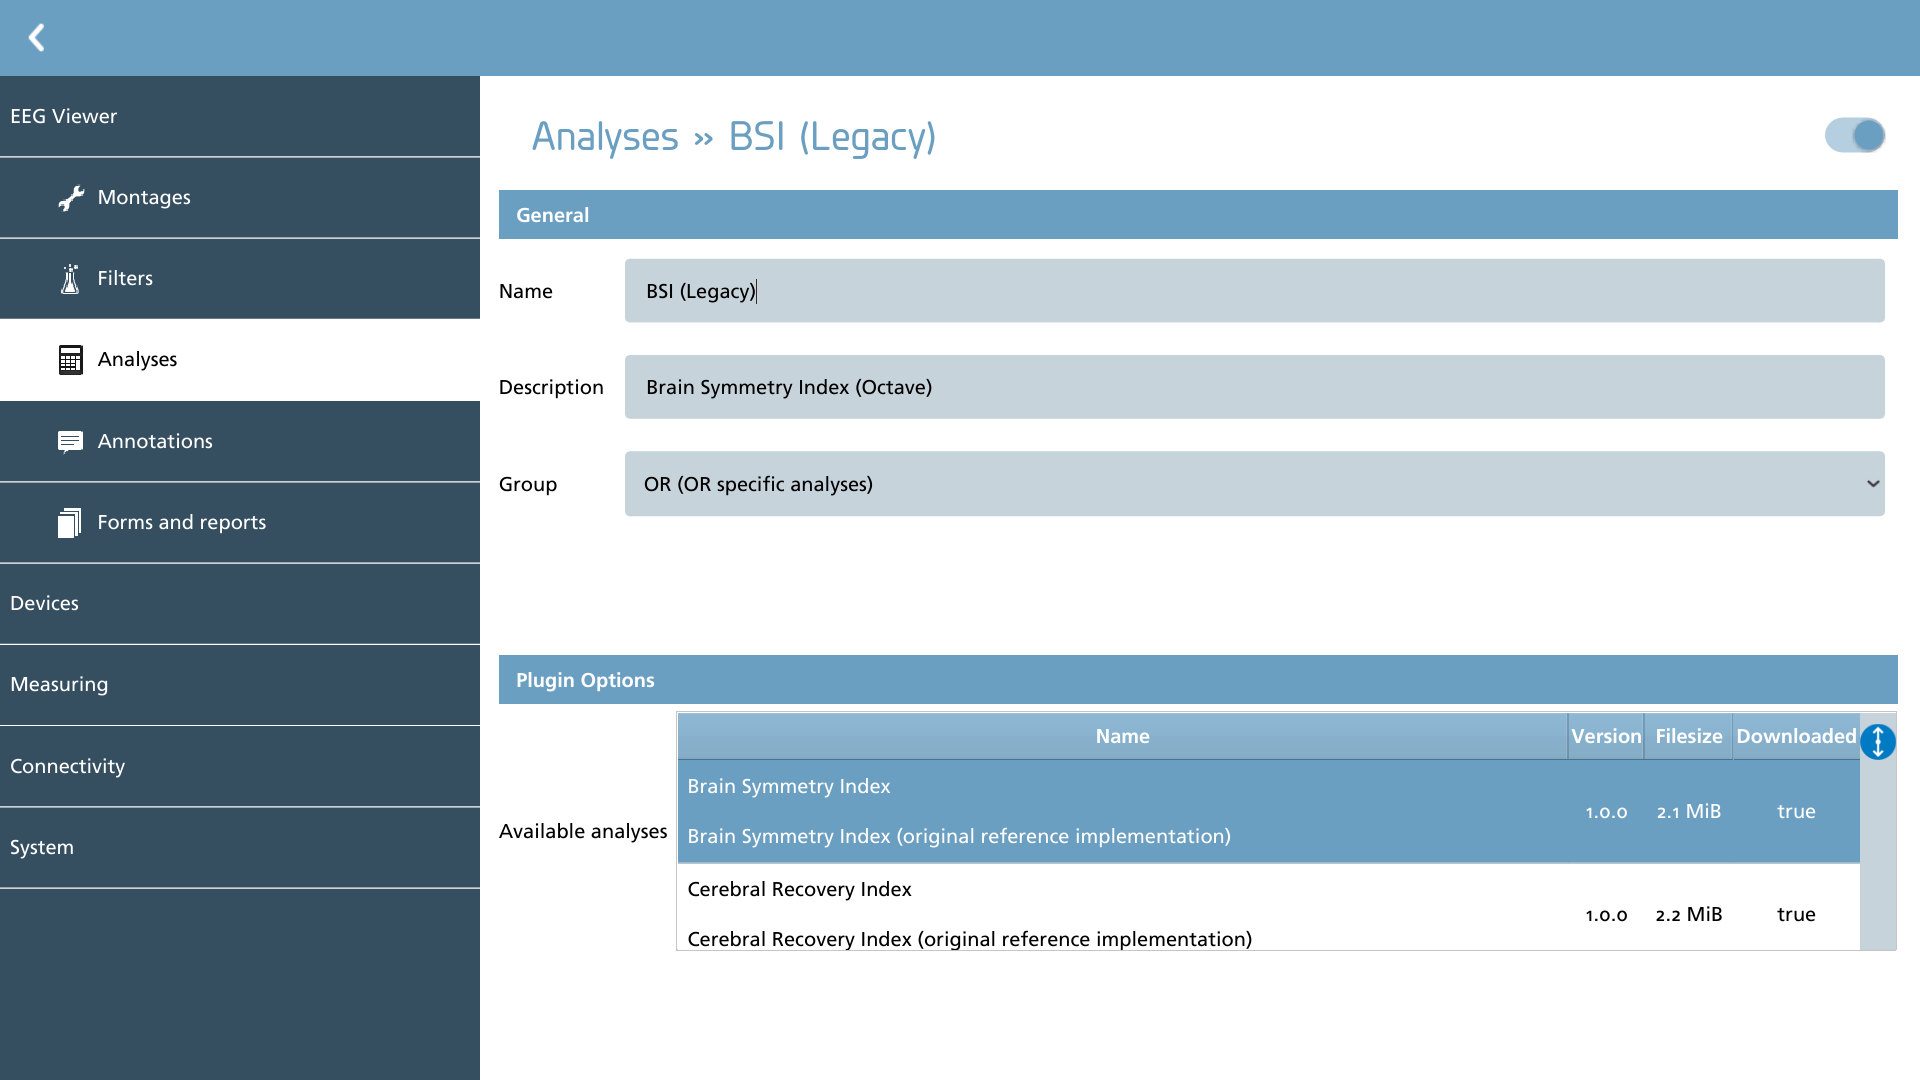
Configuration of the Octave plugin necessitates the utilization of an analysis package. These packages can be accessed from a centralized repository and must be downloaded prior to their usage. During the configuration of these plugin types, the ‘Downloaded’ column serves to indicate whether the package is already installed on the system. If the package is absent, it will be automatically downloaded upon exiting this screen.
Please select one of the available packages from the list. Once the download is complete, the icon provided within the model will replace the standard Octave icon. This new icon features a small overlay of the Octave icon in the bottom right corner, signifying that it is utilizing this specific plugin.
|
Icon |
Description |
|---|---|

|
BSI (Legacy) Calculates the original Brain Symmetry Index (BSI) |

|
CR Index Calculates the Cerebral Recovery Index (CRI) |

|
IS Assistant Calculates ICU Signal Assistant signal classification analysis |