
Overview
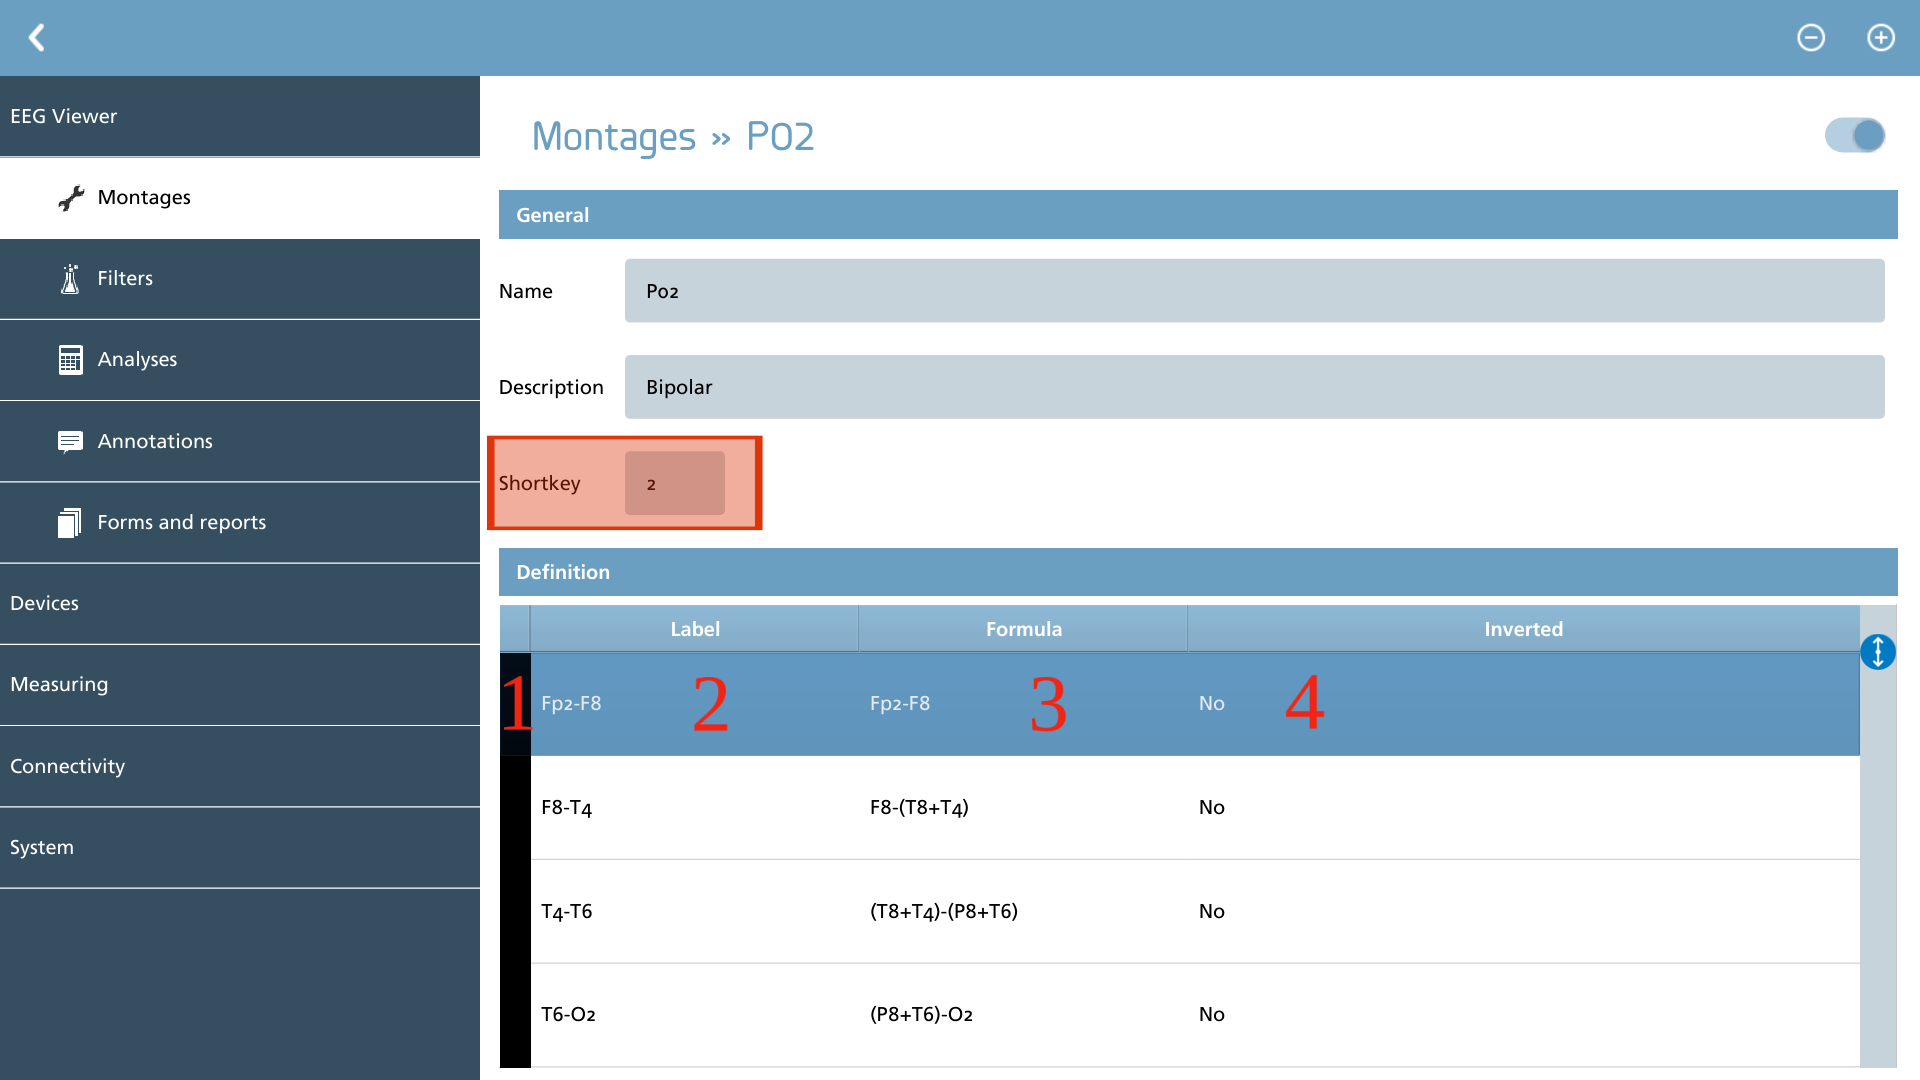
This element provides the editor for the selected montage. Within this interface, a shortcut key can be designated, which is a numeral ranging from 0 to 9, ensuring that it does not conflict with any existing numerals in use. Additionally, the channel definition can be modified, where each channel definition is characterized by the following properties:
-
Color
-
Label
-
Formula
-
Orientation
To add or remove channel definitions, the corresponding actions are displayed in the action toolbar.
|
Icon |
Description |
|---|---|

|
Add Add a new channel definition to the bottom of the existing definitions. |

|
Remove Remove the selected channel definition. |
To modify the sequence of the channel definitions, one can utilize the drag-and-drop functionality to reposition the definitions within the list, allowing for an organized arrangement.
Color
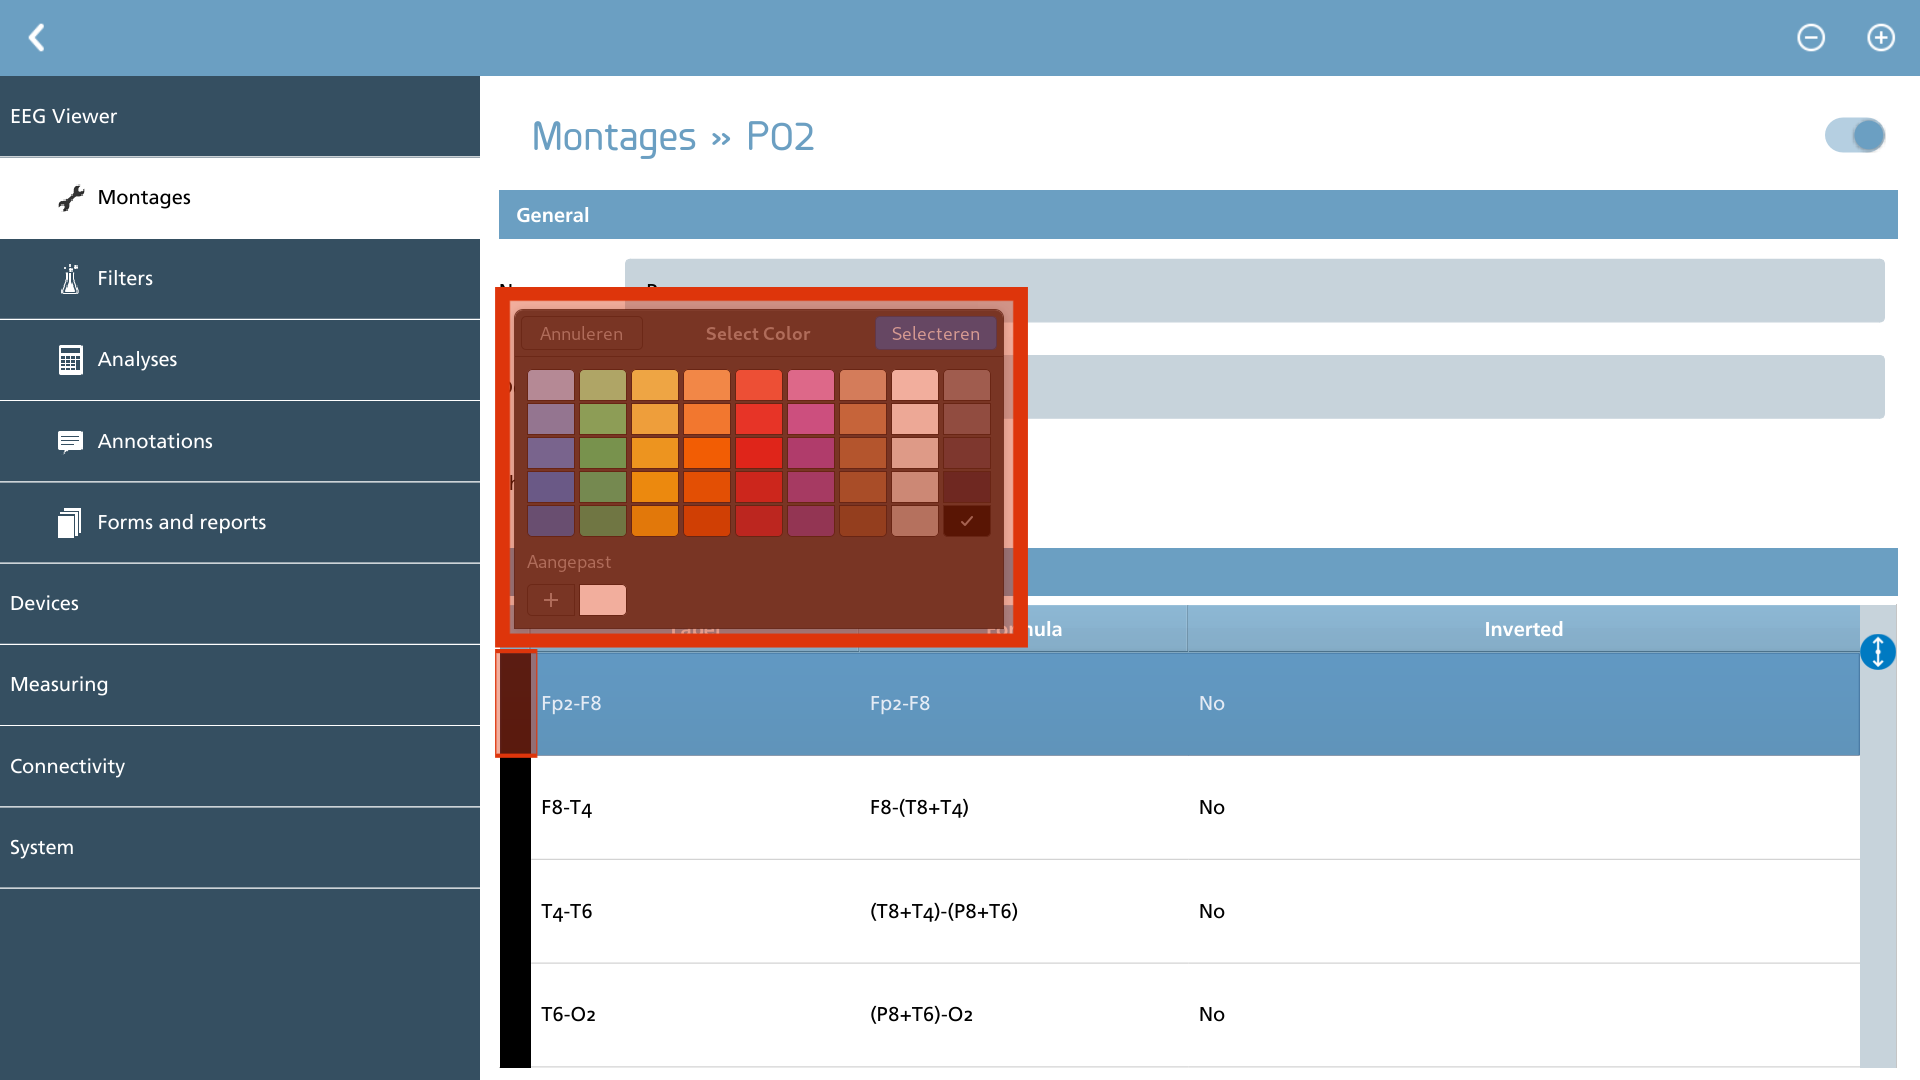
Distinguishing channels by colors provides a practical method for visualizing EEG data. If a different color is desired, one can easily double-click on the black rectangle located just before the label, which will prompt a color picker allowing for the selection of an alternative color. The black rectangle will then be replaced with the chosen color.
It is important to note that the default color black is automatically substituted with white when NeuroCenter® EEG is configured in Night Mode, while other colors remain unchanged.
Label and formulas
Both the label and formula can be adjusted by double-clicking on the desired column within the specific channel definition. Labels are displayed as they are and can be freely selected.
The formulas represent a case-sensitive depiction of the signals available in each file, devoid of prefixes and references. These formulas utilize an infix notation, supporting simple arithmetic operations such as addition (+), subtraction (-), multiplication (*), division (/), and parentheses, thus allowing for more intricate definitions.
For common average electrode positions, defined as the average of available channels, use the special channel name AVG. To relate, for example, Fp1 to its common average, use the formula: Fp1-AVG.
This method enables the scaling down of higher ranged channels (e.g., ECG, EMG) by dividing the values, for example, by 10.
Signals that are unavailable are treated as all-zeros. When utilizing the built-in montages, it is essential to ensure that all signals are present in your file and to pay close attention to case sensitivity: Fp1 and FP1 represent different channels. For those viewing an EEG for the first time, it may be beneficial to switch to a common reference montage to check for irregularities or to use the viewer’s Information overlay to obtain a list of available channels.
Inverted
In the EEG Viewer, signals are conventionally displayed with a ‘negative-up deflection.’ However, some files may be recorded differently. To adjust for this discrepancy, the ‘Inverted’ column can be activated by setting it to True. This can be accomplished by double-clicking on the column for the desired definition and toggling the switch to the active position.
Built-in montages
NeuroCenter® EEG is equipped with several built-in montages, which can be utilized for reference or active use, depending on the specific files and use-case scenarios.
|
Montage |
Description |
|---|---|
|
AVG |
Common Average montage for 10-20 setups |
|
G19 / G64 |
Common Reference for 10-20 and 10-10 setups |
|
P01 |
Double distance |
|
P02 / P03 |
Bipolar |
|
P04 / P06 |
Transverse bipolar |
|
P05 |
Laplacian |
|
P07 |
Weighed Averages |