
Overview
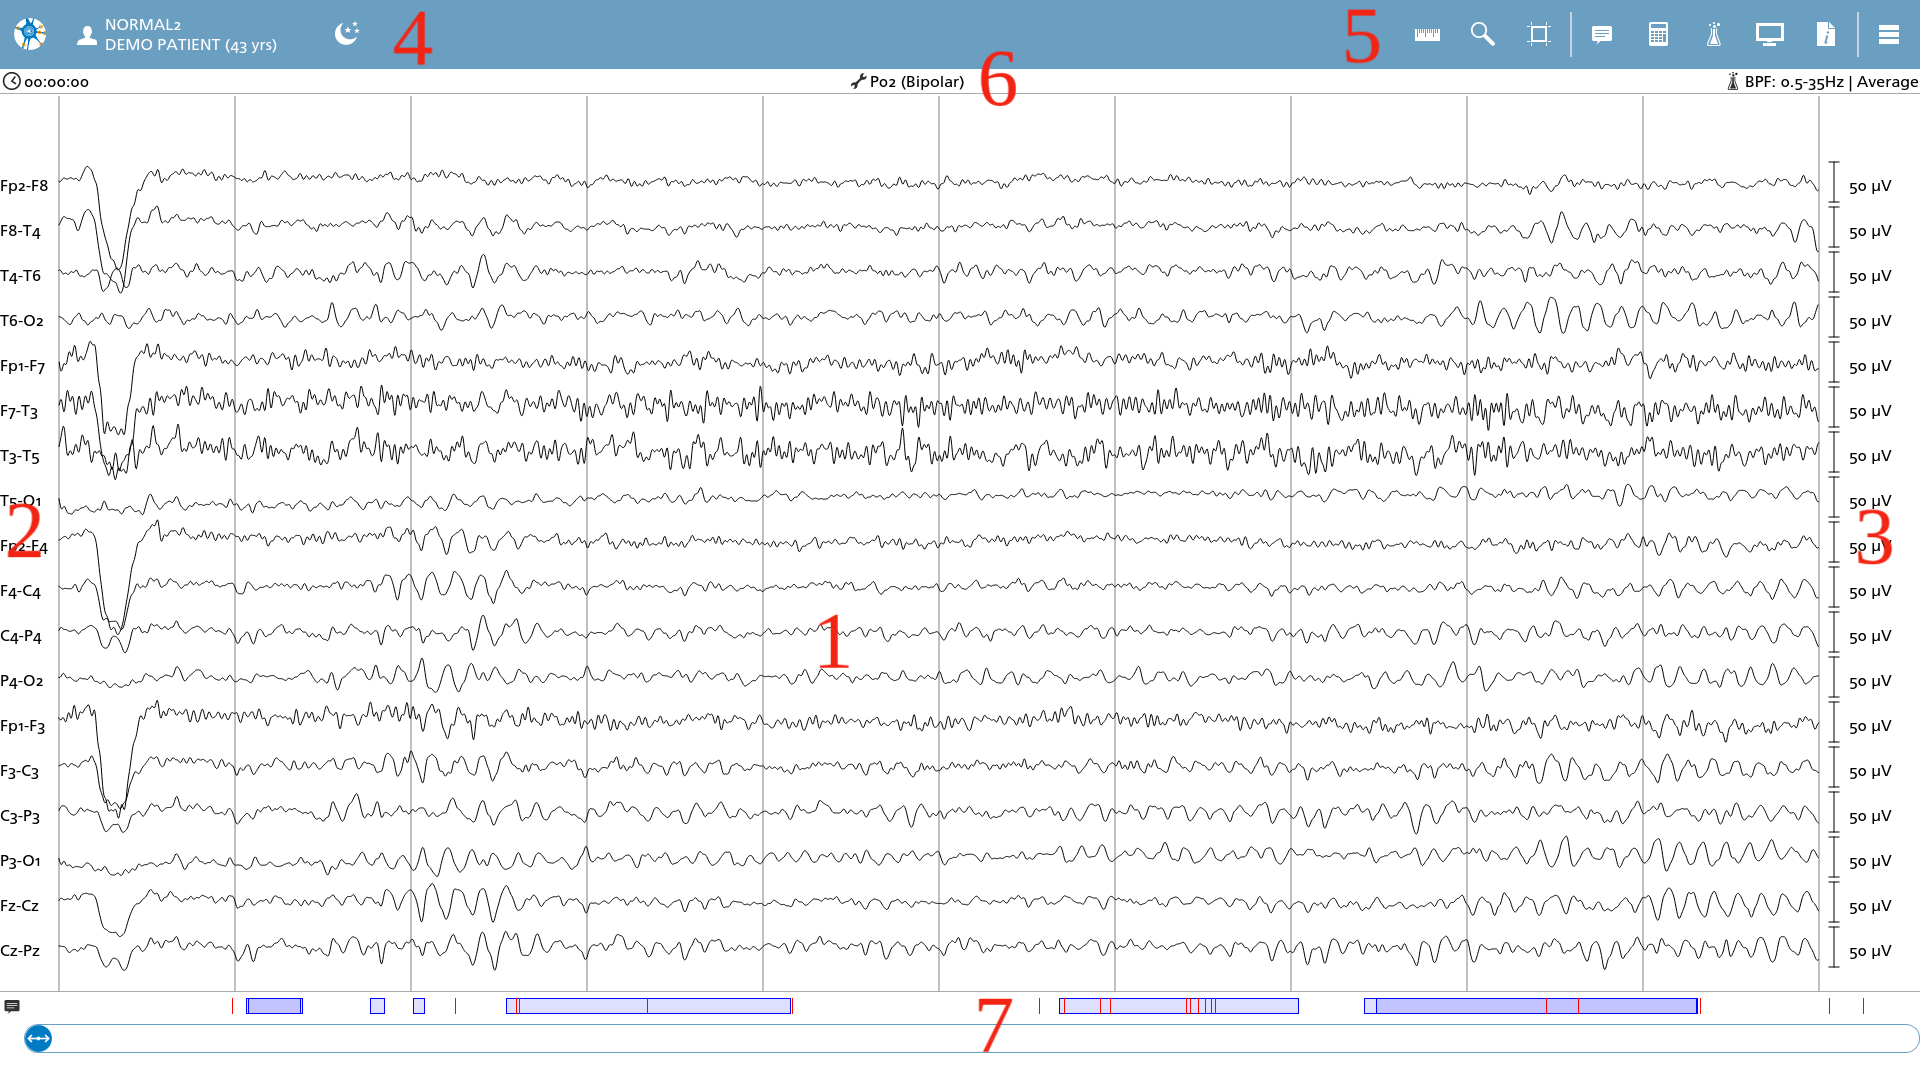
The EEG Viewer serves as a central component of NeuroCenter® EEG, facilitating the recording, review, and analysis of electroencephalogram (EEG) data. The viewer interface is activated when either review or recording actions are selected, allowing for interchangeable use of these functions. Users can simultaneously review multiple files, and the integrated navigator simplifies the process of switching between files within the EEG workspace.
Viewing Modes
The viewer offers several distinct modes, each of which slightly alters the visual presentation. This section primarily utilizes the Review mode to elucidate the various features, while the fundamental concepts are applicable across other modes. Supplemental pages are provided to emphasize the differences.
When recording an EEG, this section outlines the primary distinctions.
Sections of the Viewer
Several numbered components of the EEG viewer are highlighted below.
1. EEG Signal Overview
In this area, the EEG signals are displayed according to the currently selected montage. Alongside the EEG data, annotations are also presented, complete with their corresponding labels.
Overall Sensitivity
Users can adjust the overall sensitivity by utilizing the scroll button on a mouse or performing a two-finger pinching gesture on a touchscreen within this section.
Browsing the EEG
The EEG data can be navigated using the arrow keys. When one of the arrow keys is pressed in conjunction with the ‘SHIFT’ key, a one-second interval is employed. Otherwise, the browsing interval aligns with the viewing interval.
2. Montage Labels
The montage labels are displayed in this section. Clicking on a label allows the user to toggle the visibility of the specified signal within the signal overview.
3. Signal Sensitivity
This component illustrates the sensitivity settings on a per-signal basis. By using the scroll button on the mouse over a specific signal, users can individually modify the sensitivity for that signal.
Signal sensitivity is retained in association with the montage. This indicates that when switching between different montages, the sensitivity settings that were previously utilized for that specific montage are also reinstated.
4. Workspace navigator
The Workspace navigator provides a comprehensive display of all active EEG sessions organized in a list format. Within this structure, the open views associated with each session are hierarchically arranged. For an in-depth exploration of the workspace navigator, please refer to this section.
5. Actions
The action toolbar presents a variety of actions that are contingent upon the current mode (either review or recording) and the specific capabilities of the file being examined. The following actions are accessible when conducting a review of an EEG.
|
Icon |
Description |
|---|---|

|
Ruler Toggling this tool and dragging within the signal, displays the selected area in milliseconds and microvolt combination. In combination with the zoom action this action displays a uV / second crosshair ruler. |

|
Zoom Toggling this tool lets the user zoom in and out of the signal, by using the scroll button on the mouse or a pinching gesture on the touch screen. The selection being shown can be dragged. |

|
Selection tool Toggle this tool to select or mark a specific portion of the EEG. This tool is covered in depth in this section. |

|
Video editor Select this action to display the video editor overlay. This action is only displayed if the file selected contains video and we are reviewing the signal. The editor is covered in this section. |

|
Annotations Displays the annotations overlay for editing annotations. The annotations are covered more in depth in this section. |

|
Analyses Displays the selection overlay for starting a new analysis. The analyses are covered in this section. |

|
Filter settings Displays the filter overlay for setting the desired signal filters. The filter settings are covered in this section. |

|
Display settings Displays the settings for adjusting the display settings. These settings are covered in this section. |

|
Information Displays an overlay with information about the file, its signals and possibilities for syncing and sharing the file from a cloud storage. These options are covered in more detail in this section. |
Pinning overlays
Actions that trigger an overlay can be categorized as either pinned or unpinned. Pinned overlays are integrated into the viewer's interface, resulting in an adjustment of the viewer’s width to accommodate the overlay. Conversely, unpinned overlays overlay the viewing area and do not alter the scaling of other elements within the viewer.
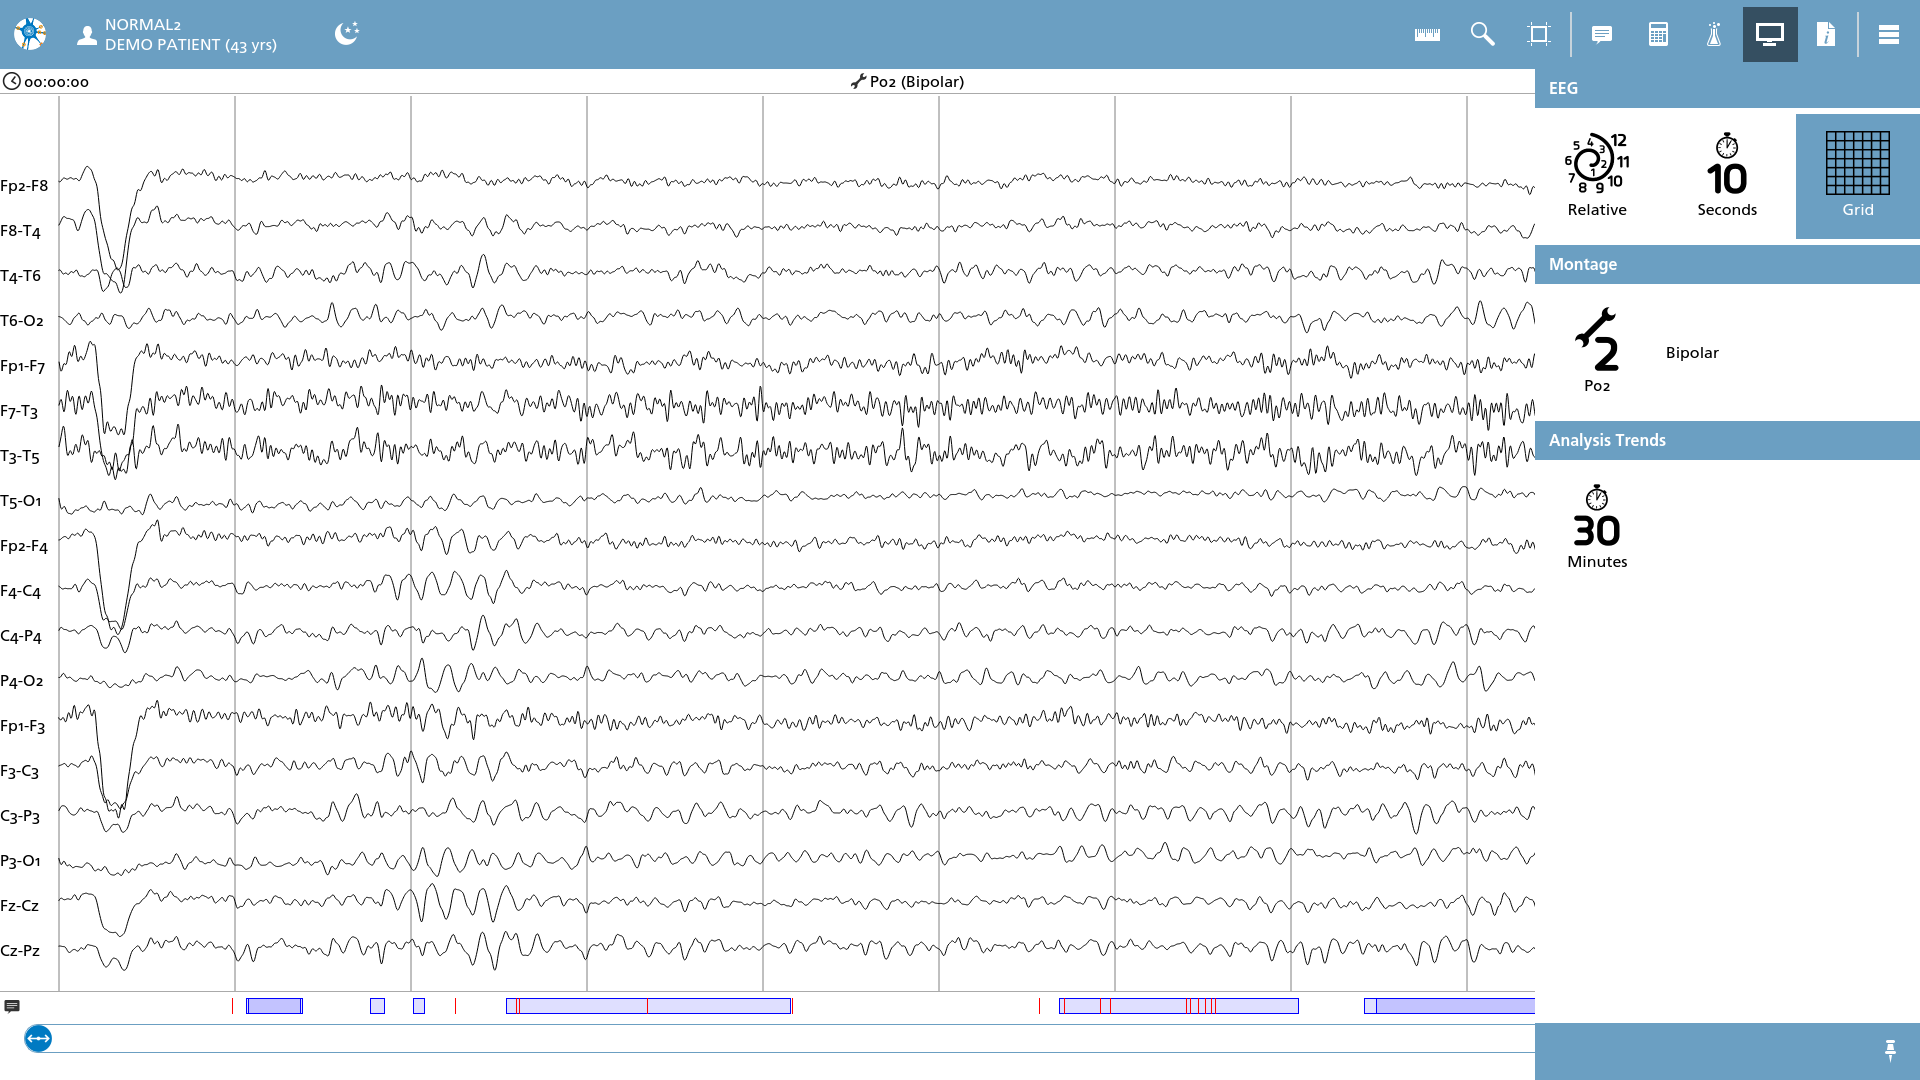
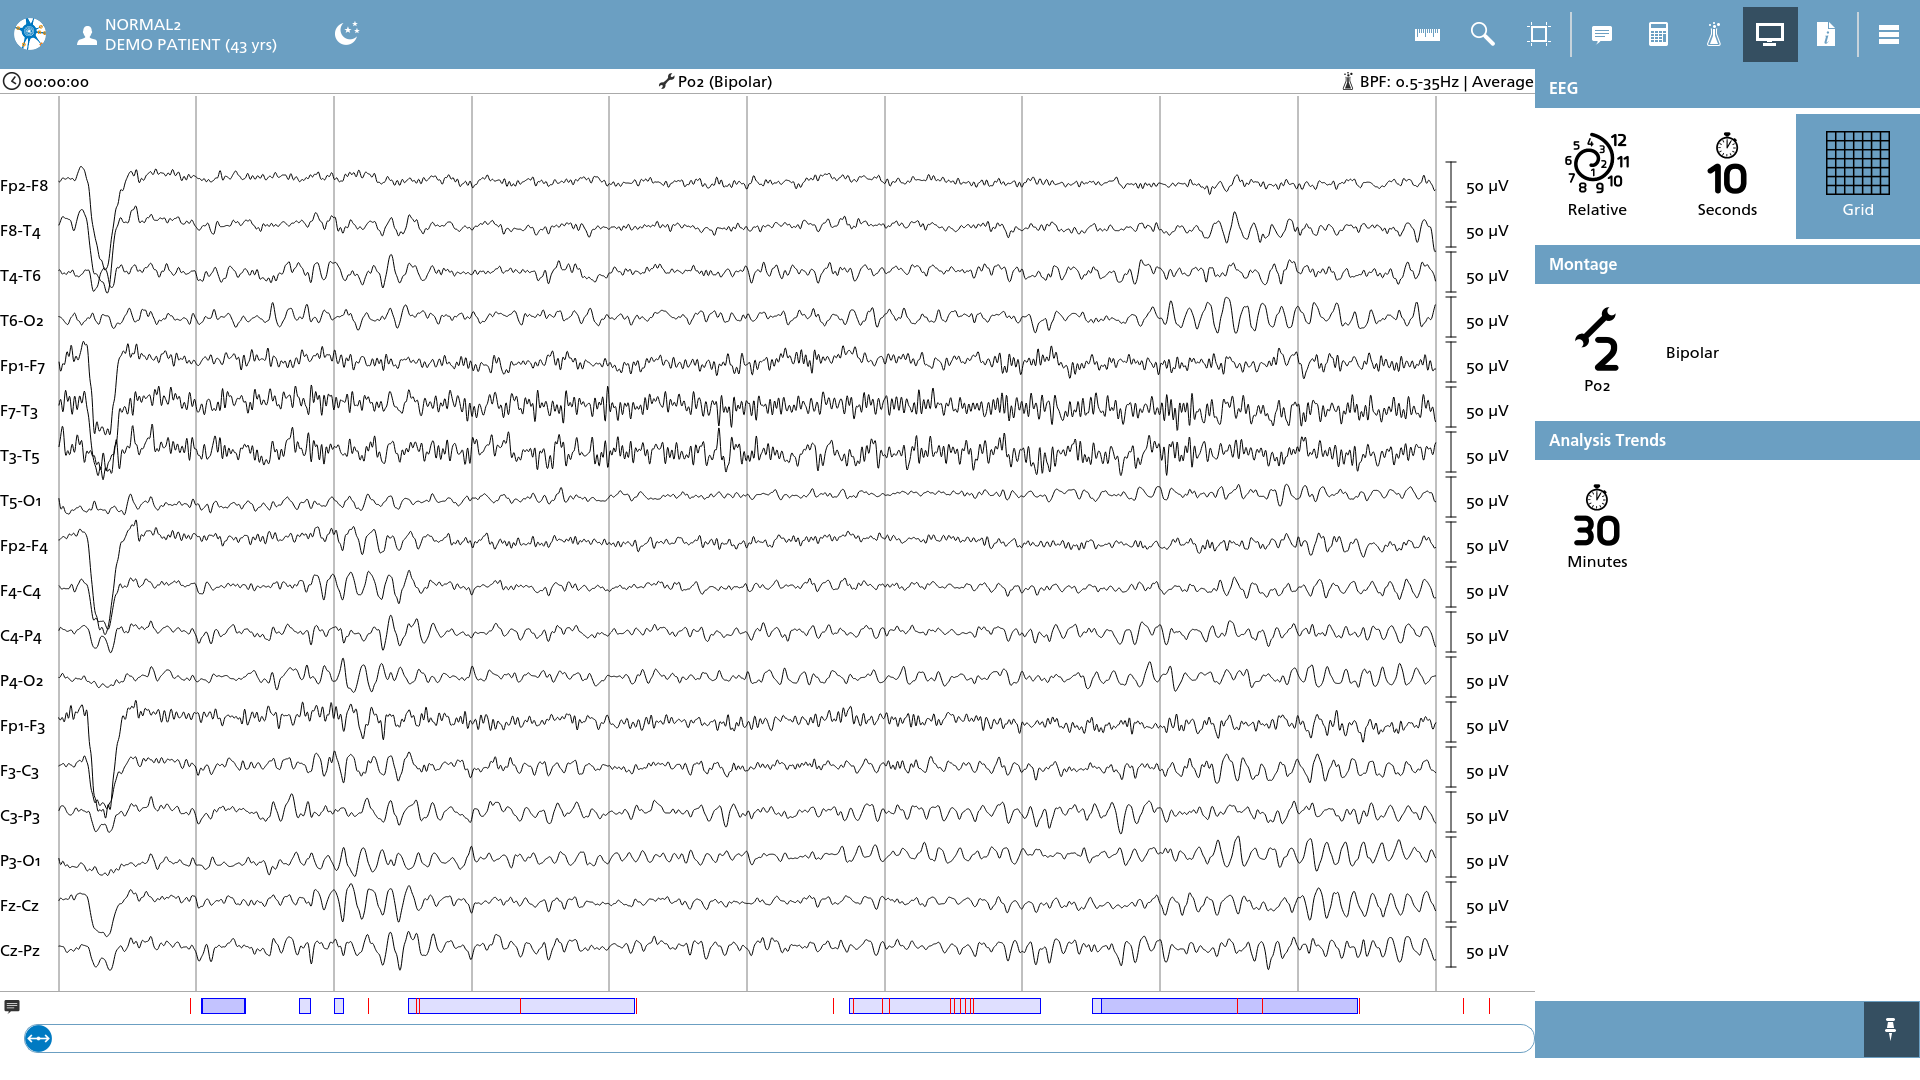
The pinned status can be modified by toggling the pin located in the bottom right corner of the overlay.
|
Icon |
Description |
|---|---|

|
Pin status Toggles the pinned / unpinned status of an overlay. |
The pinned status is stored between sessions and is a global setting, affecting all overlays.
6. Information on time, montage and filters
Here, information regarding the pertinent current viewing settings and file position is presented for quick reference. It encompasses the following details.
|
Icon |
Description |
|---|---|

|
Time Displays the current time position in the file. The time can be expressed in a relative manner concerning the beginning of the recording, as an absolute value, or in terms of pages. The mode can be modified in the Display Settings. |

|
Montage Displays the name and description of the current montage. Montages can be changed in the Display Settings. |
|
|
Filters Displays the filters currently applied to the displayed signal. These filters can be modified in the Filter settings. |
7. Position slider and annotation markings
The position slider serves a crucial function in monitoring the current location relative to the complete measurement. When the slider is situated at the left-most position, it indicates that the file is at the beginning of the measurement. Conversely, when the slider is at the right-most position, it signifies that the file is at the end of the measurement. The slider is dynamically updated as the user navigates through the signal or can be manually dragged to reposition the file.
Above the position slider, one can find the annotations bar, which presents all annotations. The positioning of these annotations on the bar corresponds to the entire measurement.
Given that the position slider and the annotation bar are aligned, users can efficiently utilize the slider to navigate directly to a specific annotation.