Overview
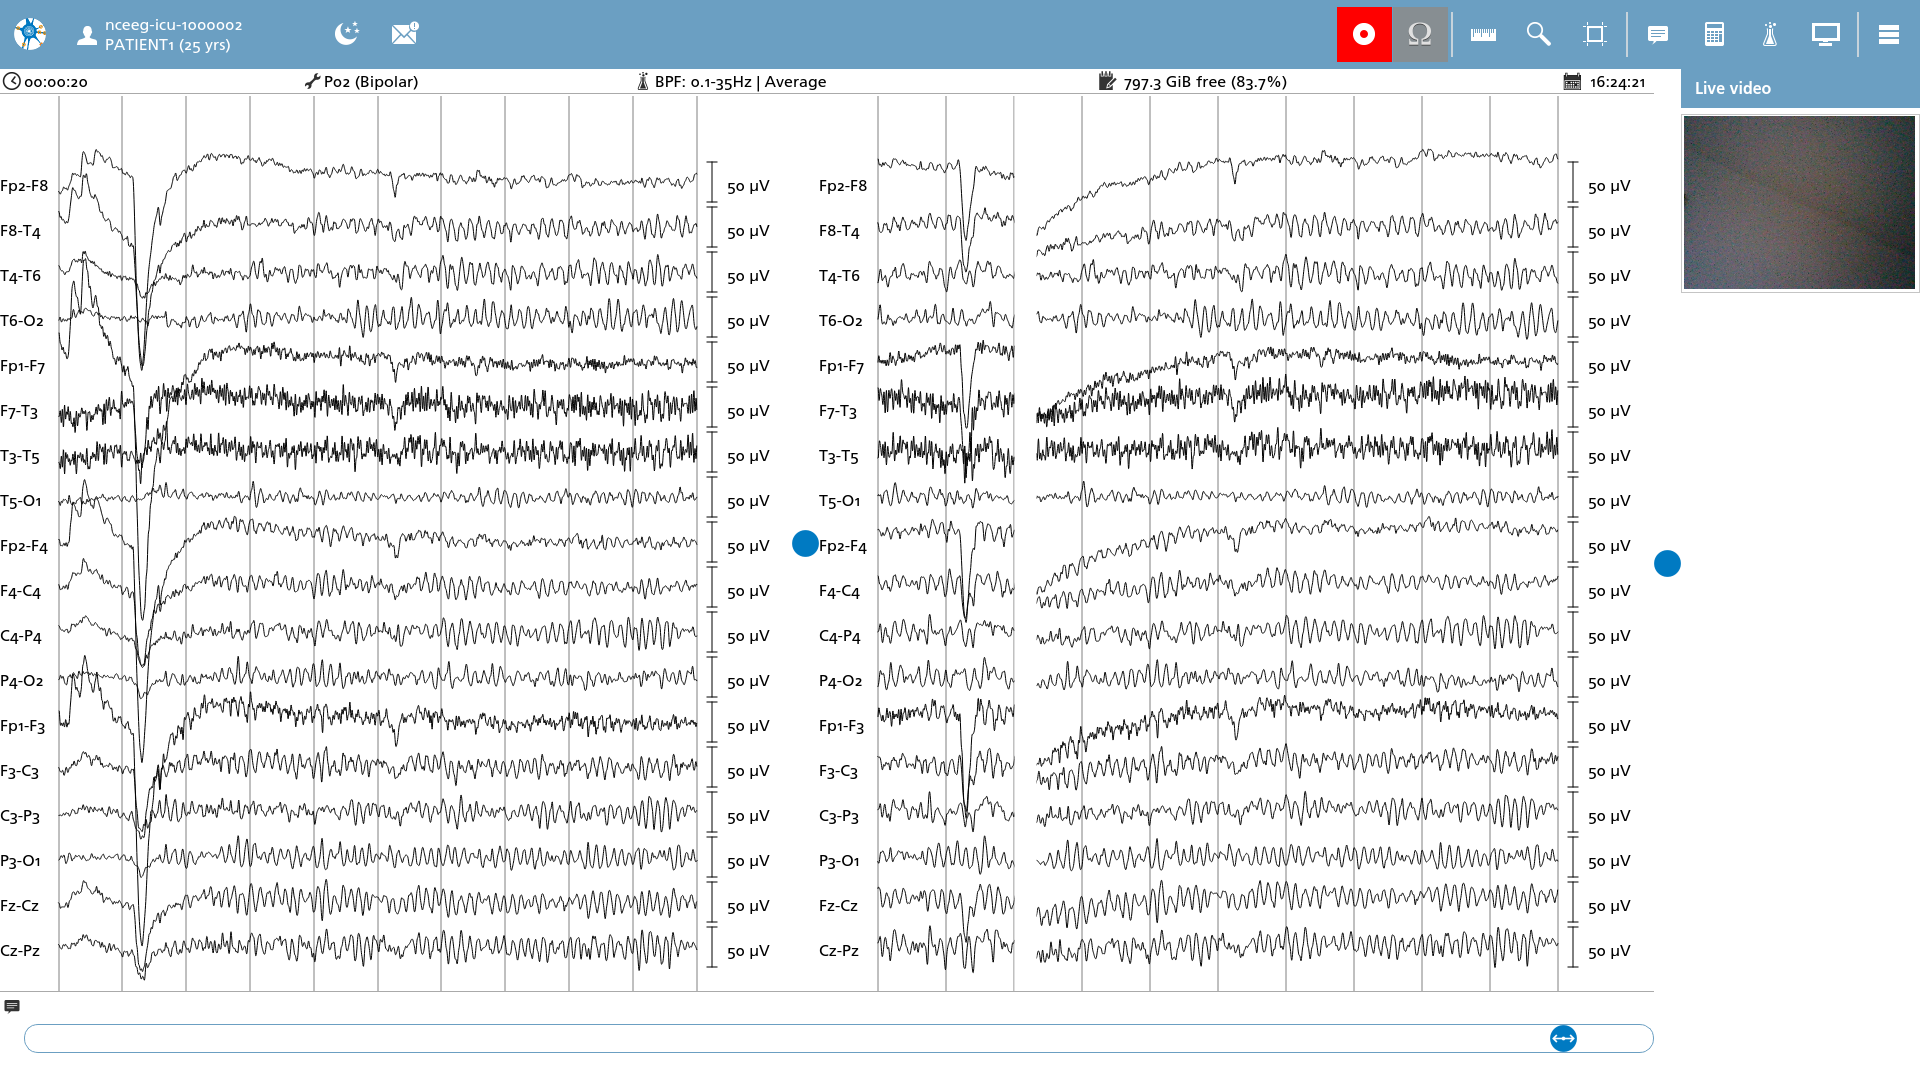
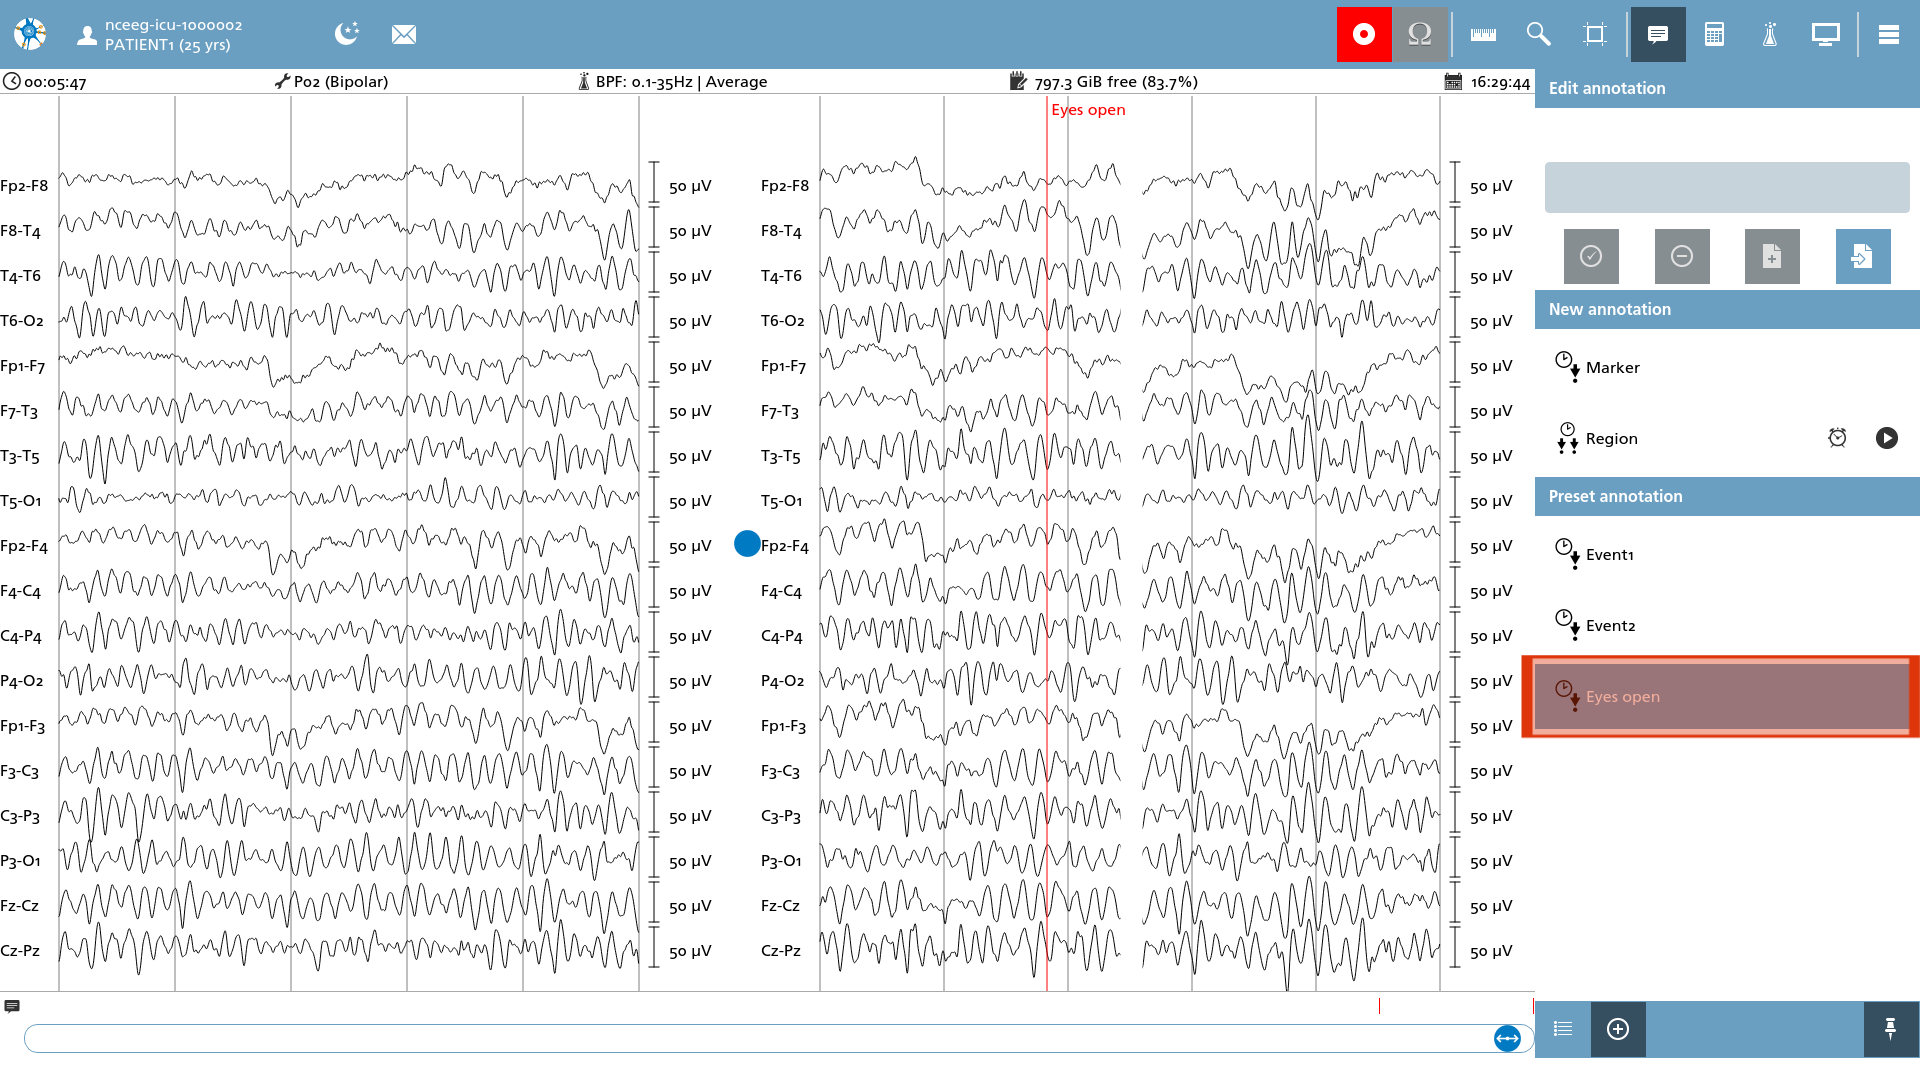
Recording an EEG slightly modifies the EEG viewer interface. However, the fundamental functionalities remain intact, with additional options available for managing the recording process. The distinctions and enhancements are elaborated upon in the following sections.
EEG Real-time Viewer
The primary enhancement is the introduction of a new real-time viewer located to the right of the static EEG viewer, which displays EEG data as it is transmitted from the amplifier. The current position of the data is indicated by a white eraser bar that updates continuously as new data becomes available. When the viewer is displaying data but recording has not yet commenced, a watermark appears stating ‘NOT RECORDING’.
This real-time viewer is updated at a dynamic interval to ensure that system usage remains within reasonable limits. On less powerful systems, this may result in less frequent updates compared to higher-end systems.
It is important to note that the real-time EEG viewer does not take storage settings into account; it simply displays data as it is retrieved from the amplifier and processed through the designated filters. Always refer to the static viewer (located on the left side) to verify that the file is being stored correctly.
The data displayed in the real-time EEG viewer may differ from that of the static EEG viewer. Real-time data is decimated more aggressively than static data to optimize overall system performance. This discrepancy is particularly noticeable when higher viewing interval settings are employed. If you experience this issue, consider reducing the interval to mitigate the problem.
Certain specialized signals, such as trigger signals, may also be decimated too aggressively in the real-time viewer, leading to distortions or flat lines in the display. If you encounter this issue and require these signals to be visible in the real-time viewer, it is advisable to exclude these channels from the screen optimizer. For guidance on configuring the decimation filter, please refer to this section.
Workspace navigator
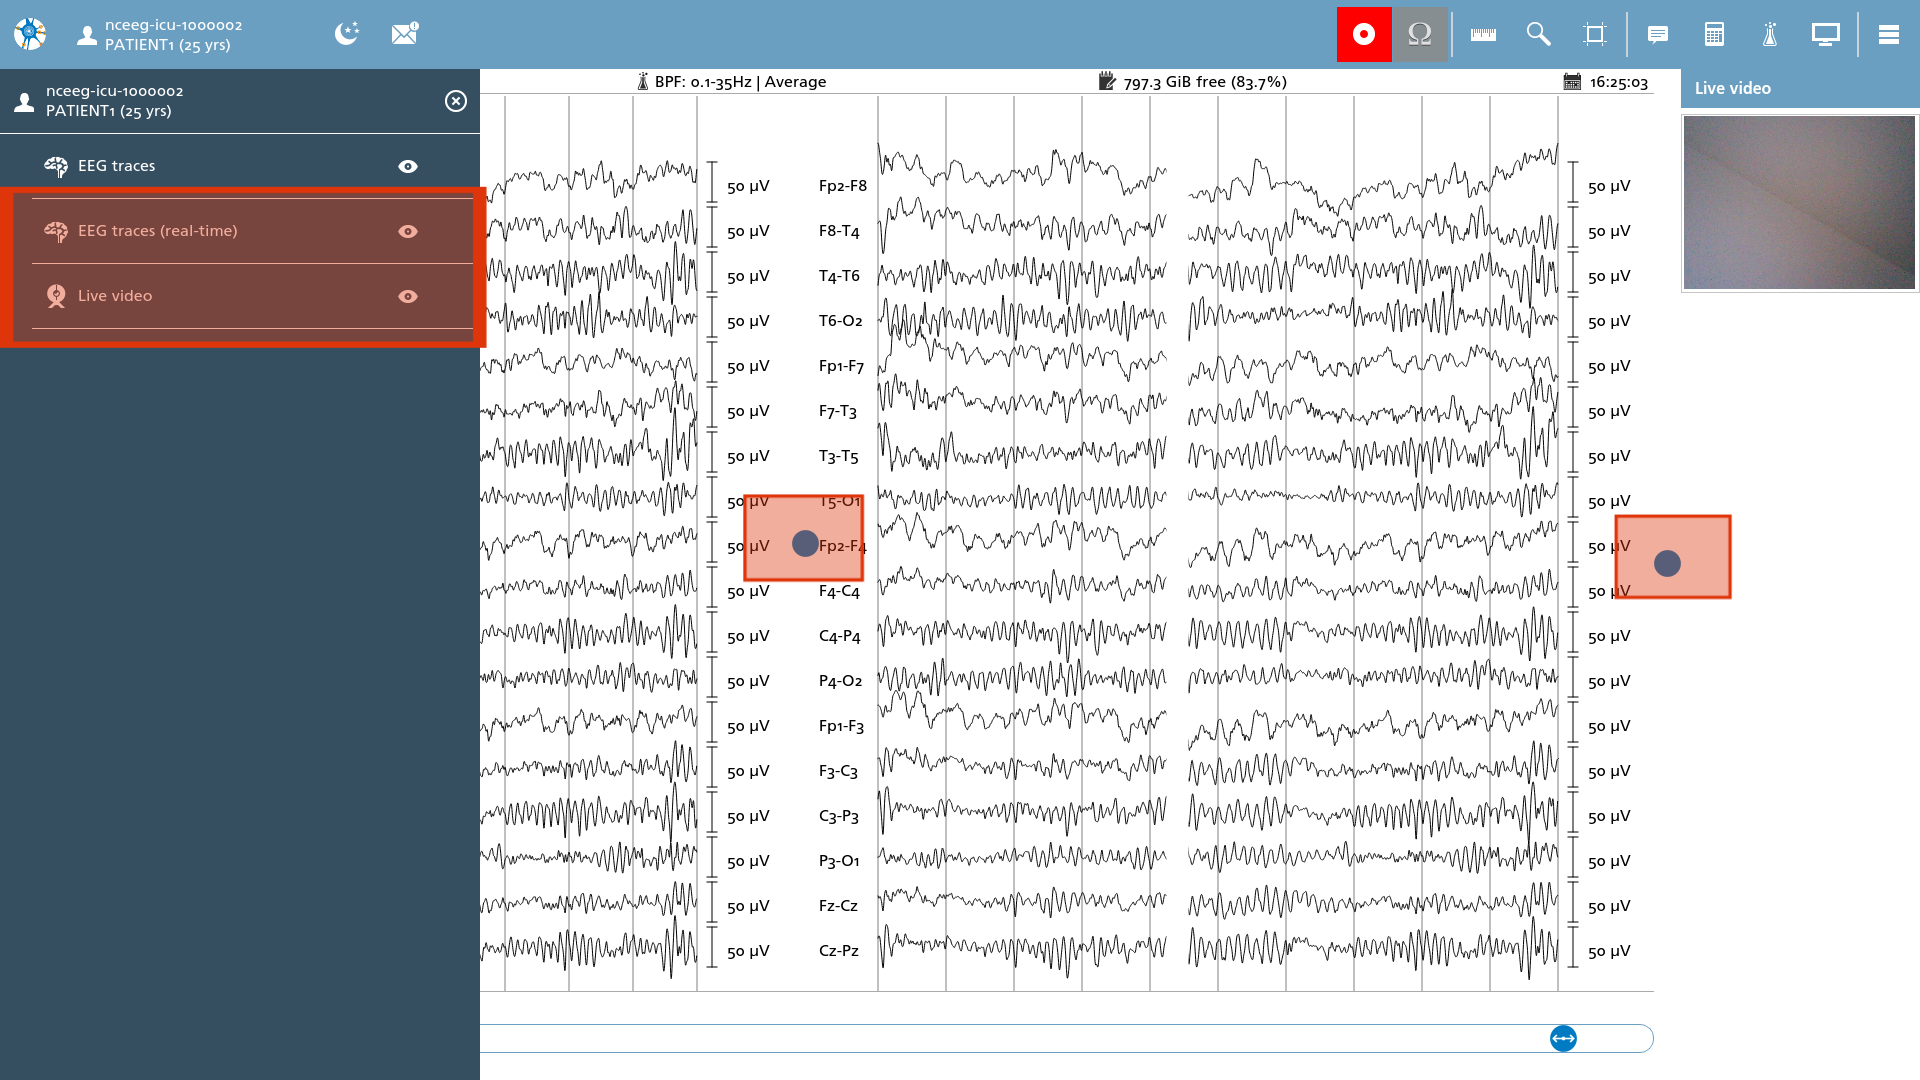
The workspace navigator features additional entries for EEG traces displayed in real-time, as well as Live video, if defined in the protocol. While both of these viewing components can be concealed, they cannot be entirely closed. The blue spheres positioned between the viewing elements serve as a mechanism for resizing these components in relation to one another.
Action toolbar
The action toolbar has been updated to include new functionalities and no longer features the ‘Information’ action.
|
Icon |
Description |
|---|---|

|
Record Toggles recording on and off. When recording is enabled, the action is highlighted in red. |

|
Impedance When selected an impedance overview of the connected signals is presented. This action is only enabled when recording is switched off. |

|
Execute recording script When selected, the recording script, as delineated in the protocol, is executed. If a script is defined in the protocol, this option is automatically activated at the commencement of the measurement. Conversely, when deselected, the script is paused at its current position. |
Impedance measurement
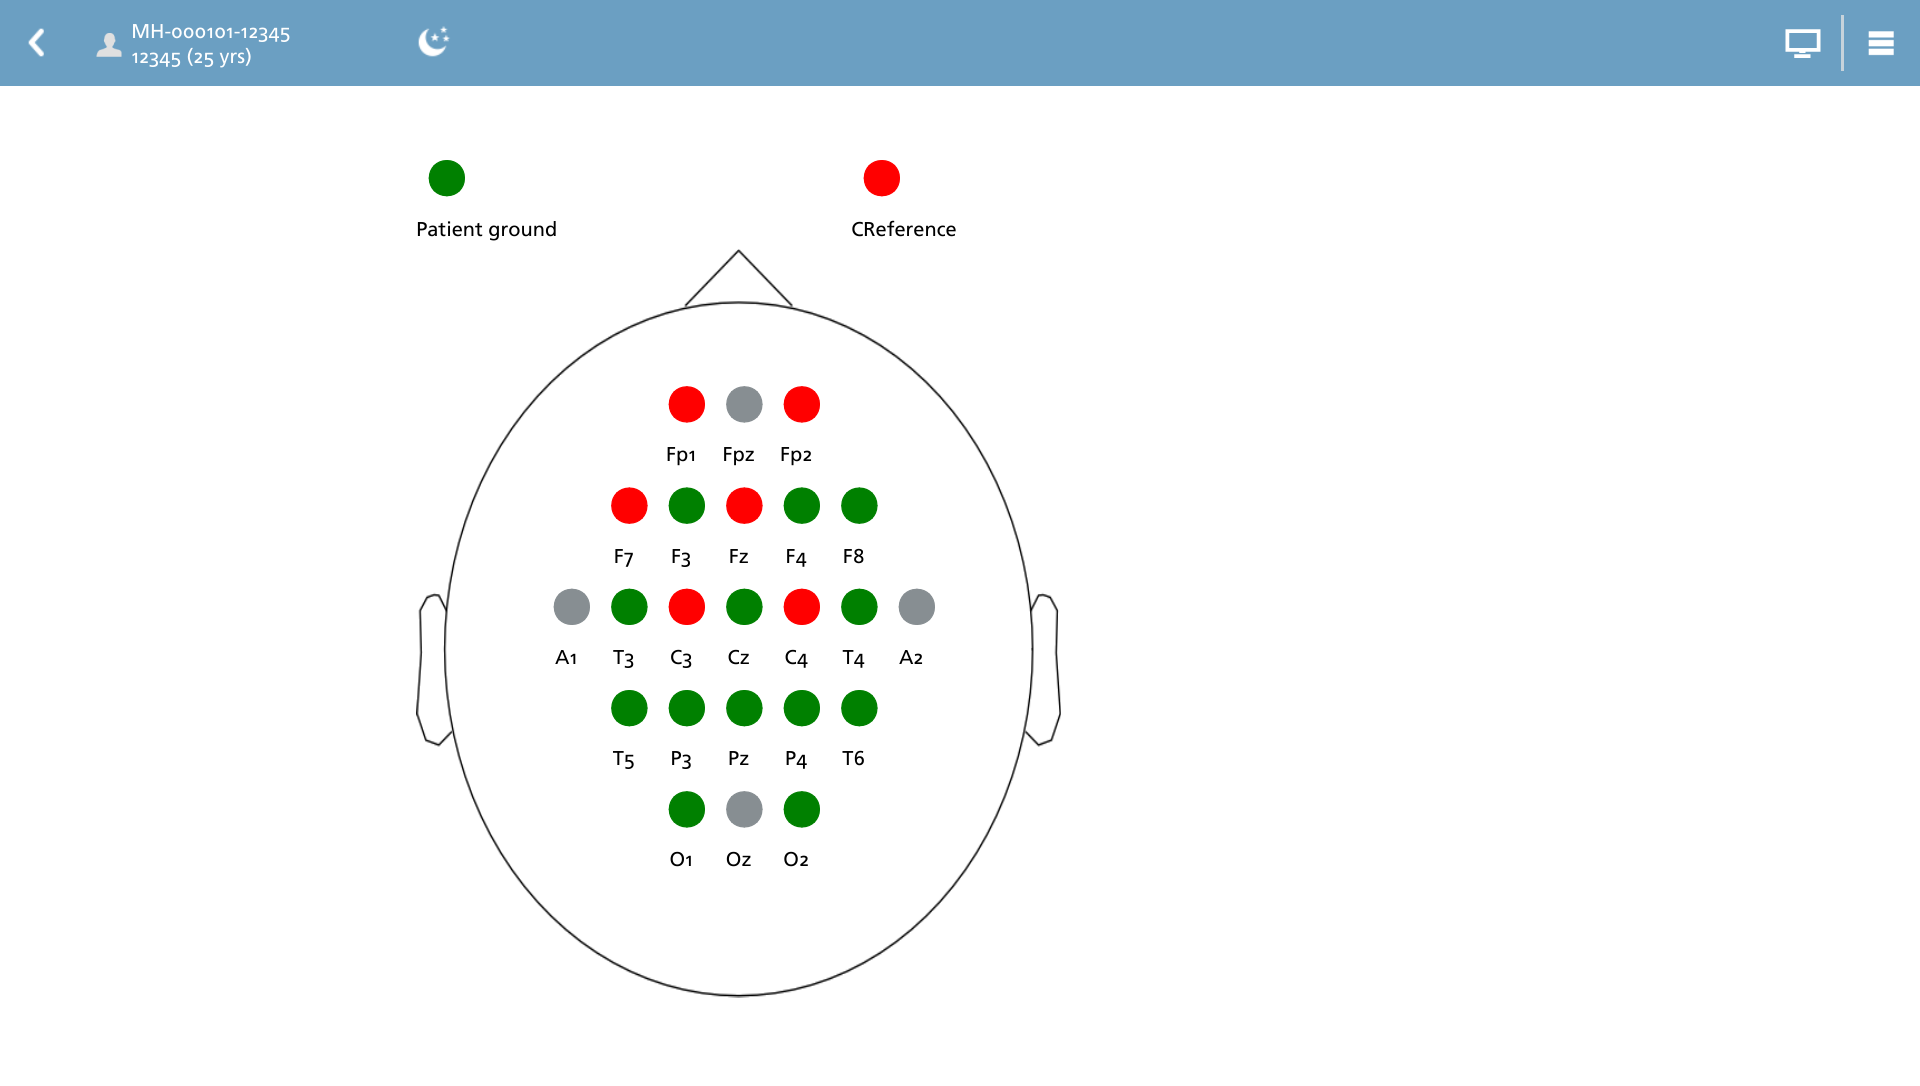
When the impedance measurement option is selected, the interface transitions to the head layout view, displaying individual electrodes. Impedance is displayed in relation to the selected impedance specified in the protocol. Green signals signify that the impedance is lower than or equal to the established threshold, while red signals indicate that the impedance exceeds the set threshold. Signals represented in grey are deemed unavailable for this particular measurement.
The action toolbar is refreshed in this view and comprises the following actions.
|
Icon |
Description |
|---|---|

|
Return to EEG Viewer Ends the impedance measurement and returns to the EEG Viewer. |

|
Impedance settings Modify the display settings for the impedance measurement. |
When invoking the settings, an overlay will be displayed that provides relevant options and configurations for user interaction.
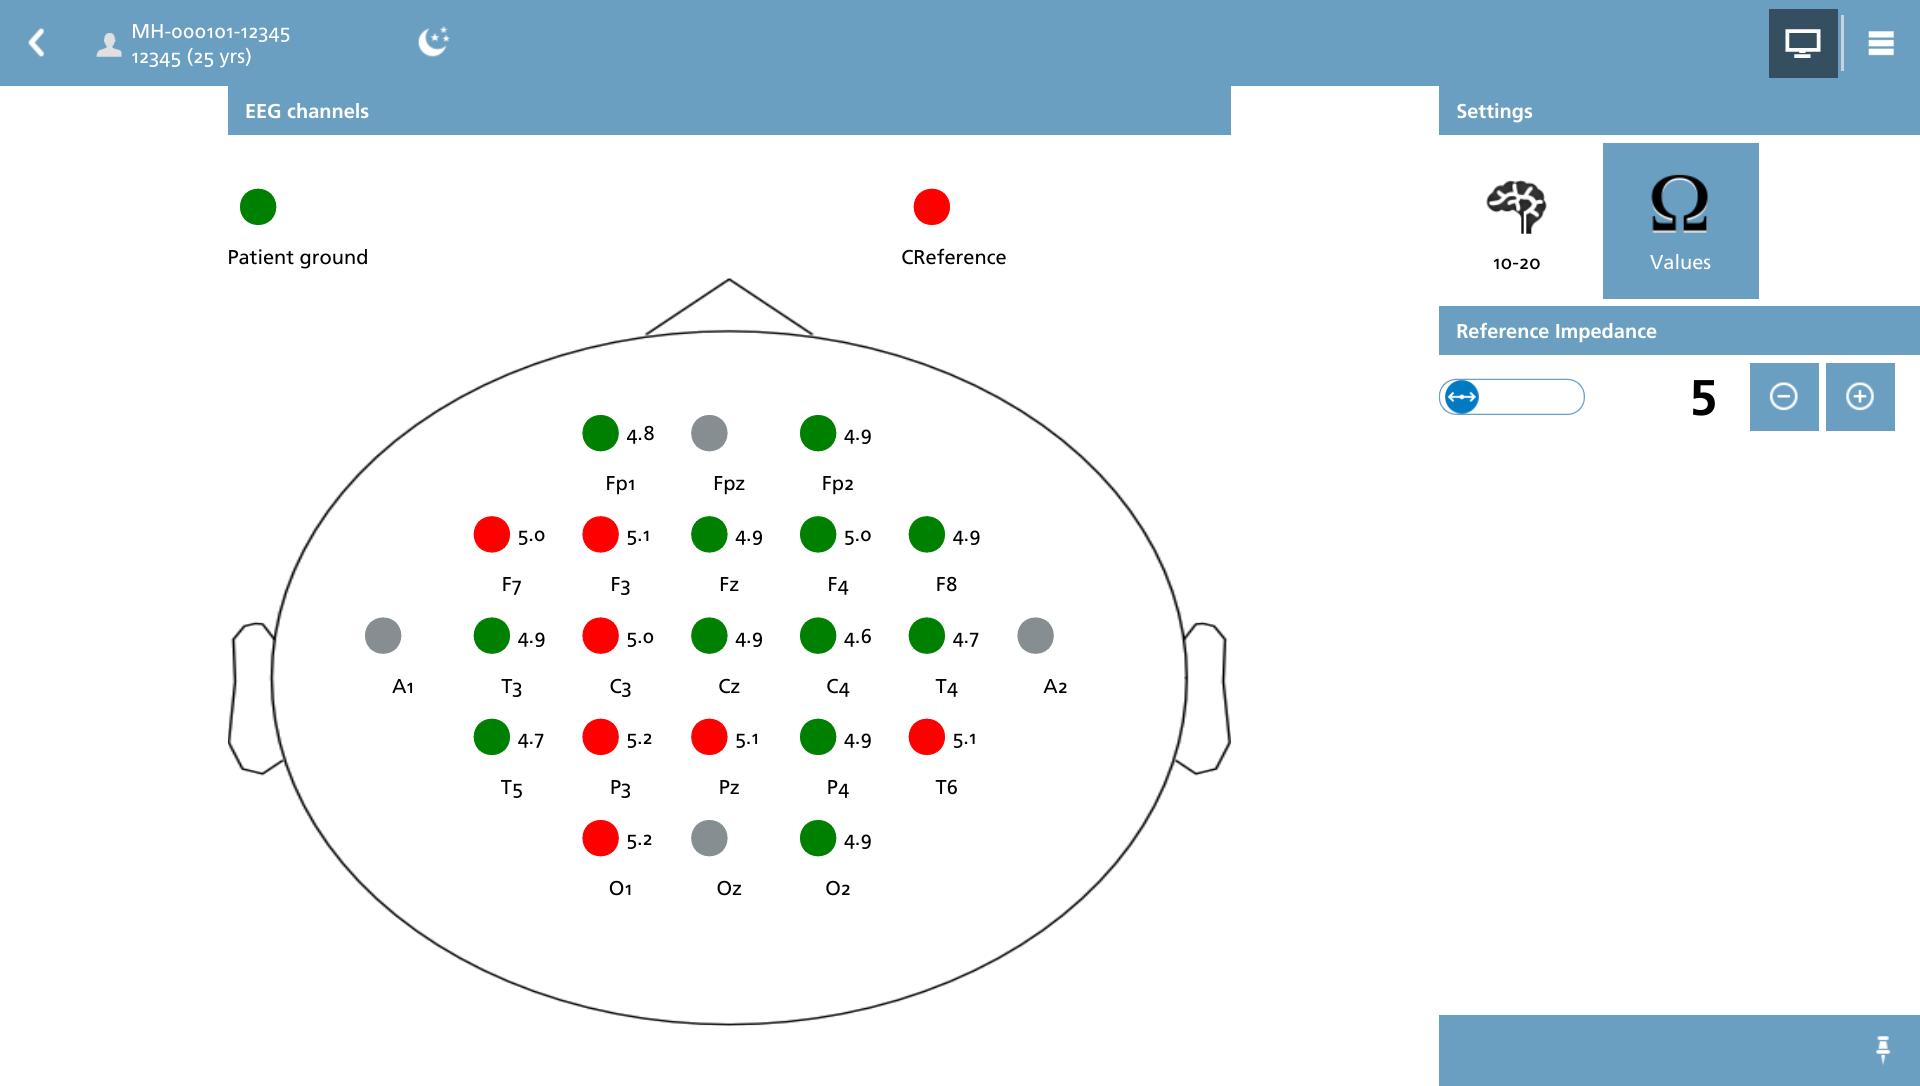
Within these settings, several items can be modified for display purposes:
-
The system utilized for electrode placement can be selected from the following options: 10-20, 10-20 (MCN), or 10-10.
-
The display of live values in kOhm can be toggled on or off.
-
The reference impedance threshold can be adjusted using the + and - buttons to change the value in increments of 5 kOhm.
When the signals present in this measurement do not conform to the selected electrode placement system, they are categorized as ‘Other channels’.
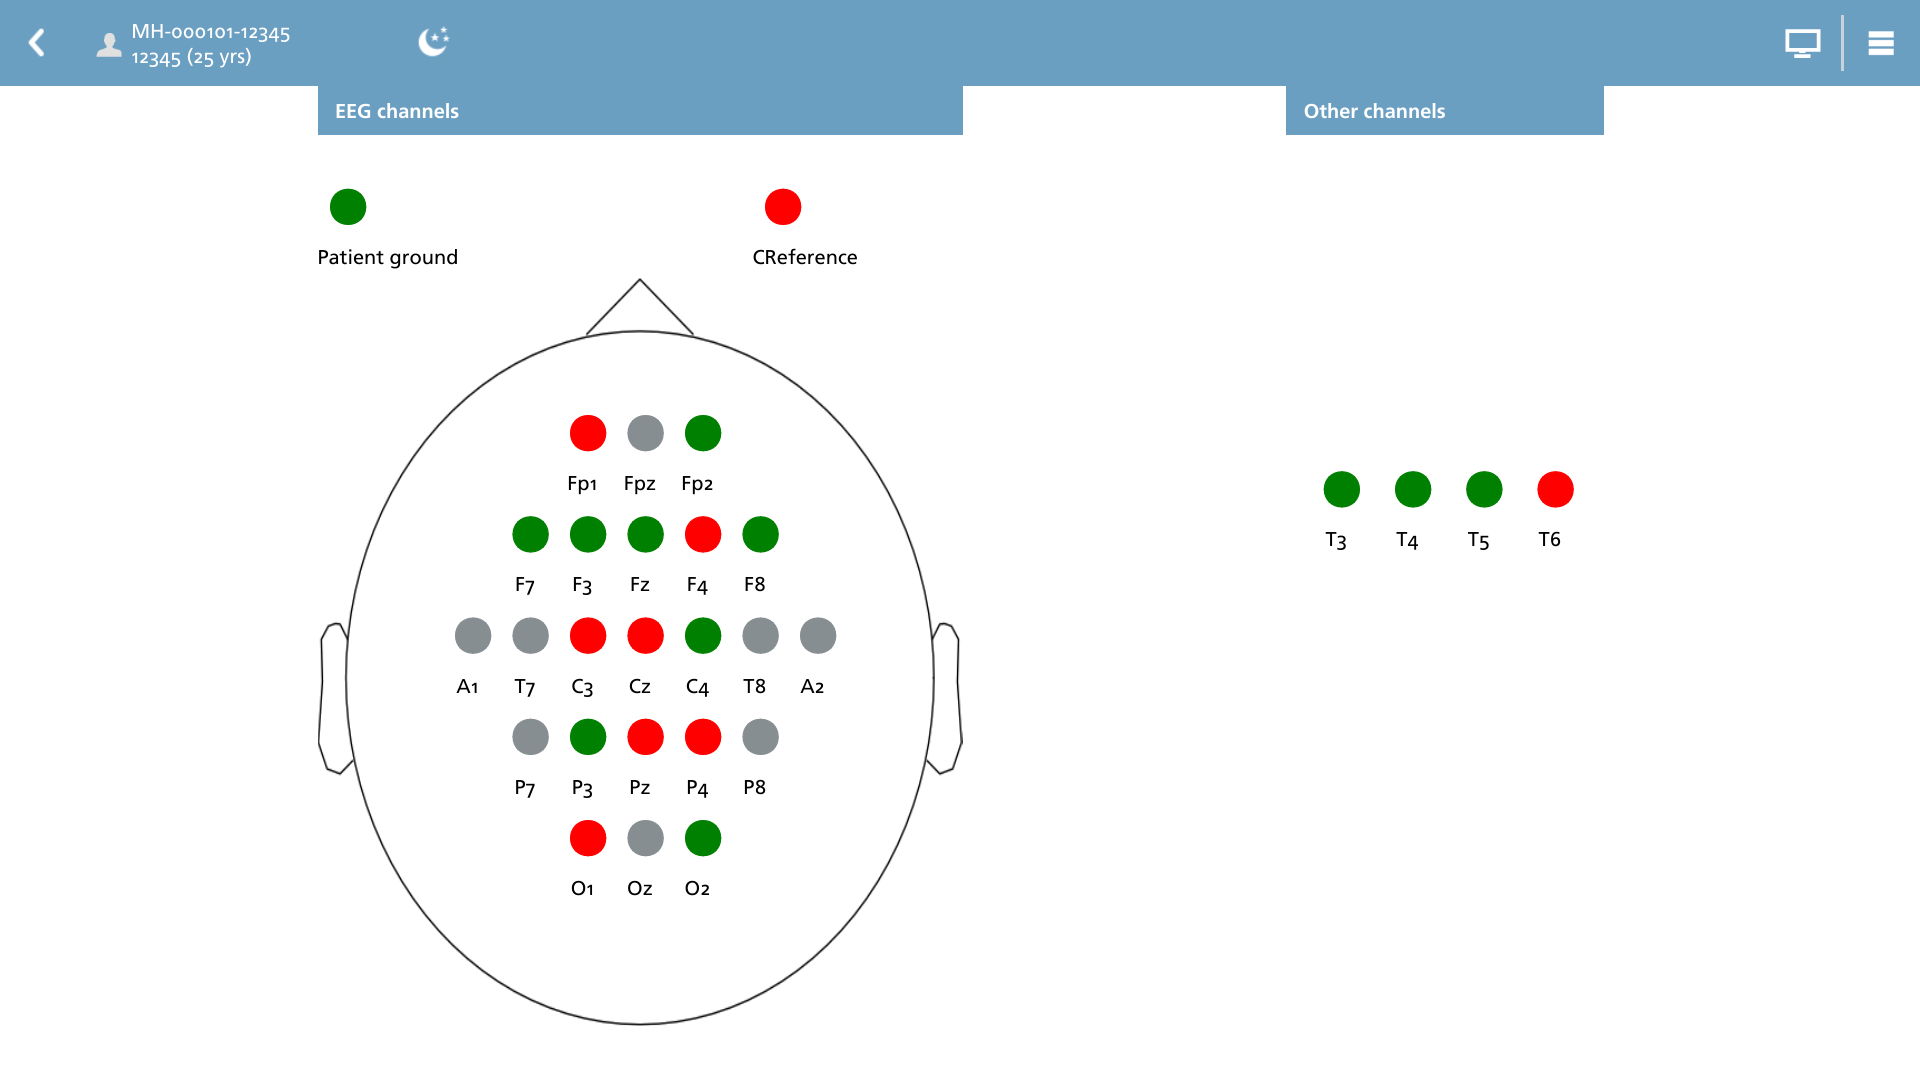
Always begin by verifying the integrity of the patient ground electrode and, if relevant, the impedance of the common reference electrode. These electrodes are crucial for ensuring accurate data registration. If all other electrode placements meet the required threshold, consider replacing the patient ground electrode prior to making adjustments to individual electrodes.
Information on time, montage and filters
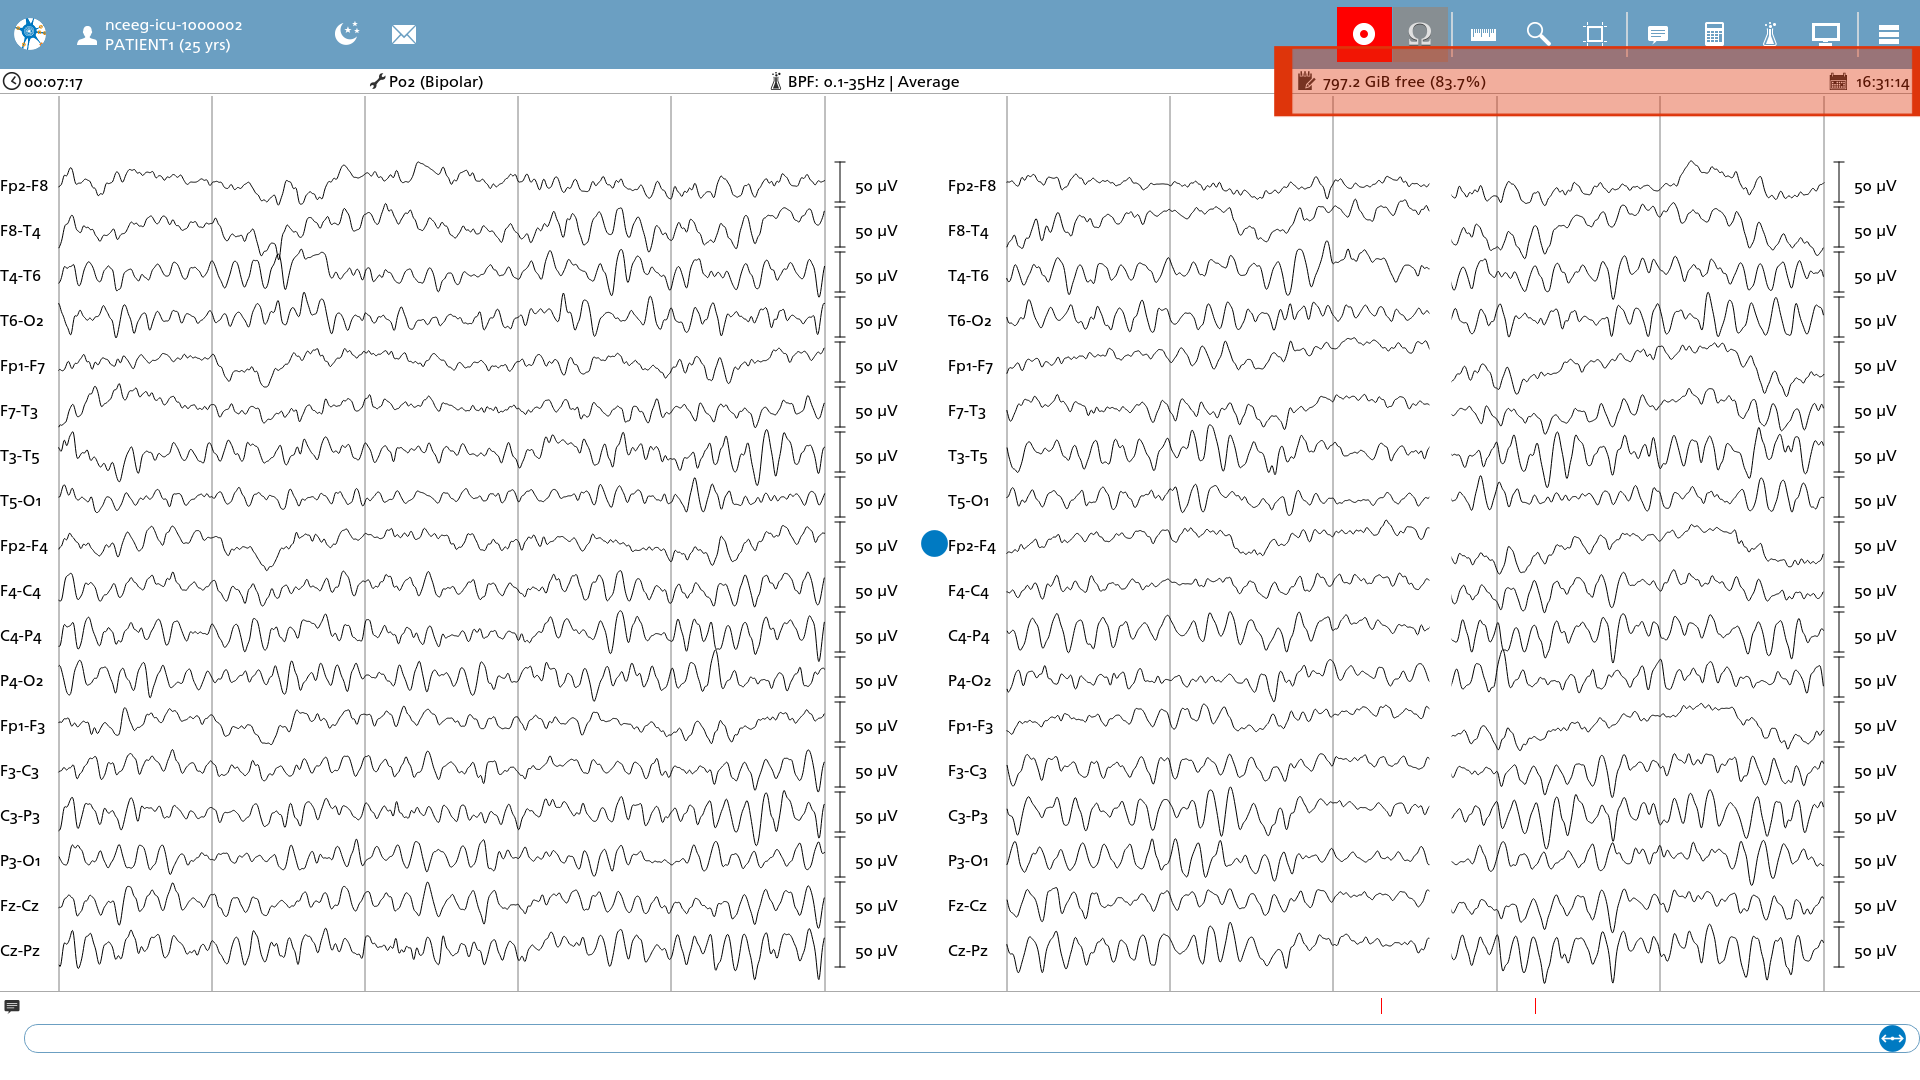
Two additional indicators are integrated into the information line situated just above the EEG signals:
-

-

Position slider and annotation markings
The position slider and annotation bar are refreshed every second as new data is recorded to the file. When the position slider is moved to the end of the file, its position (along with the corresponding static data) is automatically updated when a new complete viewing interval becomes available in the recording. Conversely, if the slider is moved backwards beyond this range, the viewing interval will no longer be updated.
Display settings
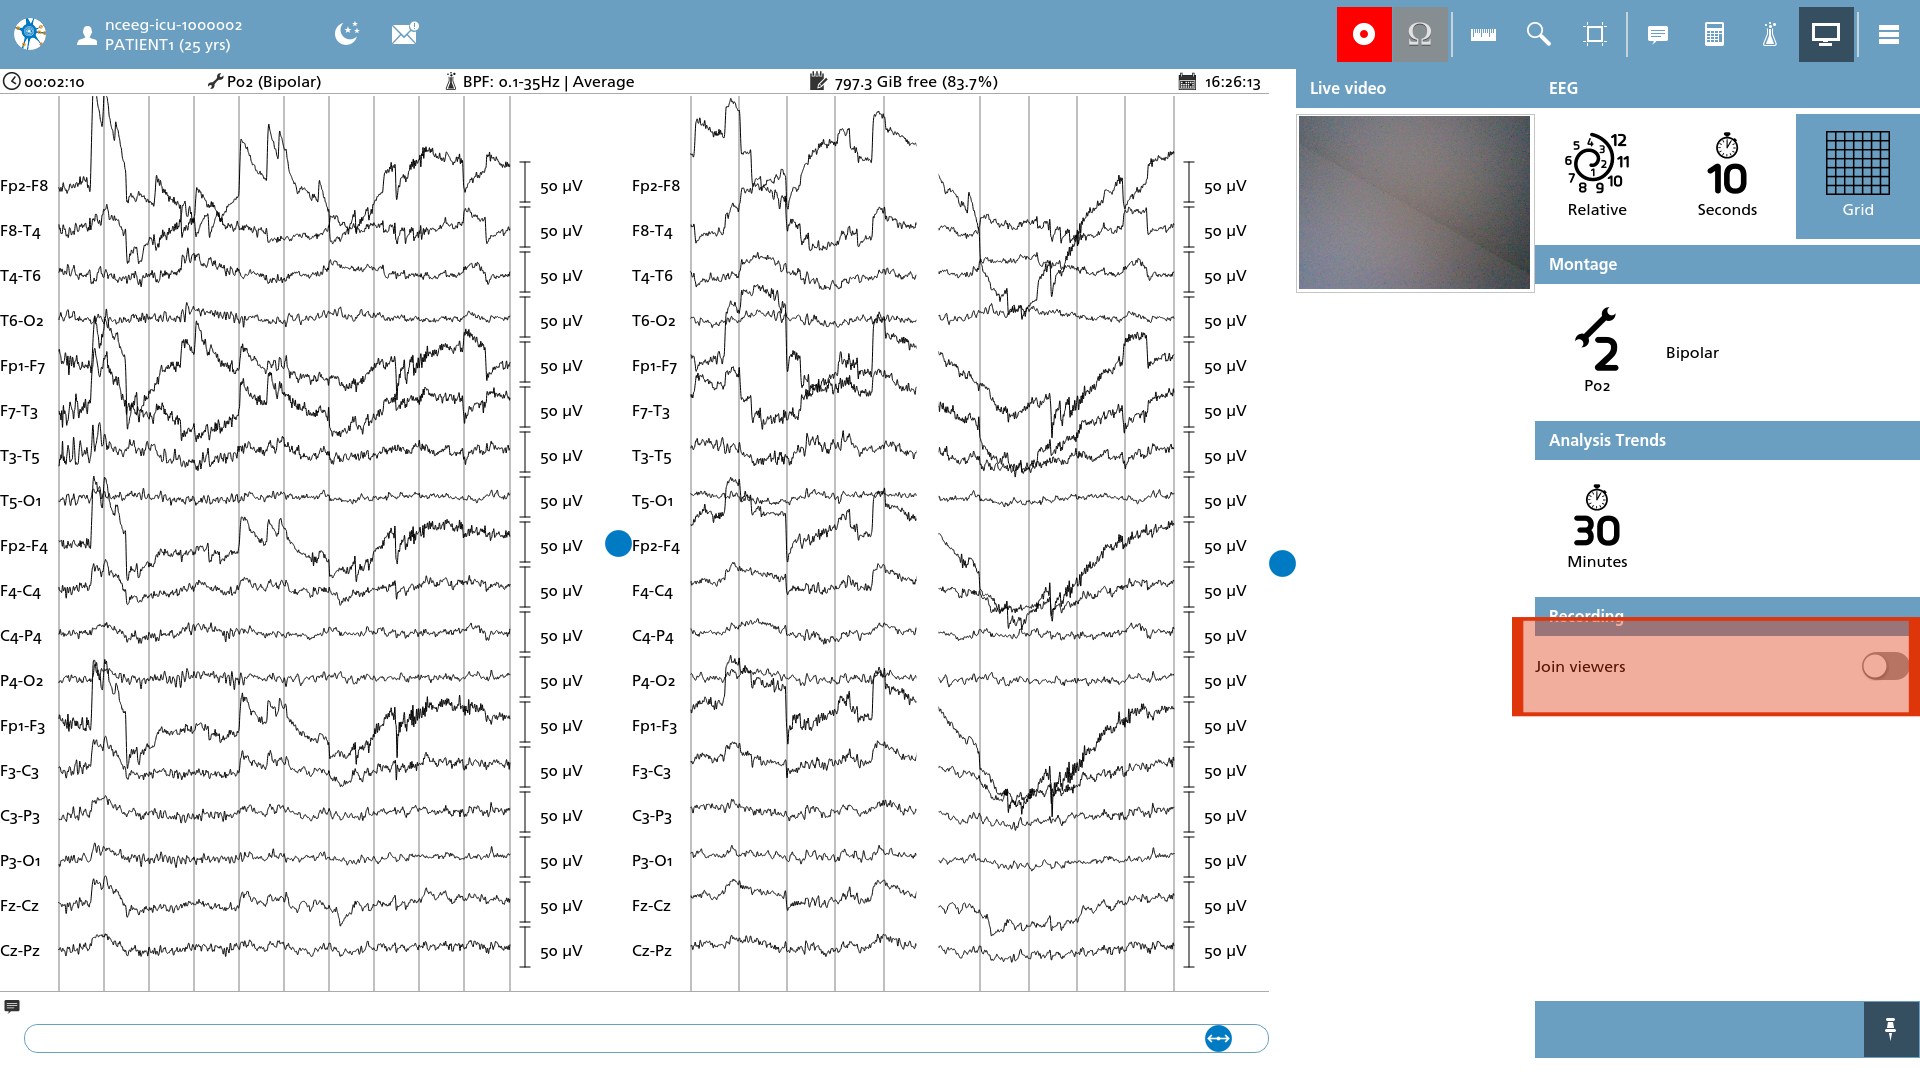
Display settings now incorporate an action labeled ‘Join viewers’, which effectively connects both the static viewer and the real-time viewer. The sensitivity settings associated with the static and montage labels from the real-time viewer are concealed. The toggling of montage labels allows for the visibility or concealment of signals in both viewers. Additionally, when adjustments are made to sensitivity in the real-time viewer, these changes are also reflected in the static viewer.
Analyses
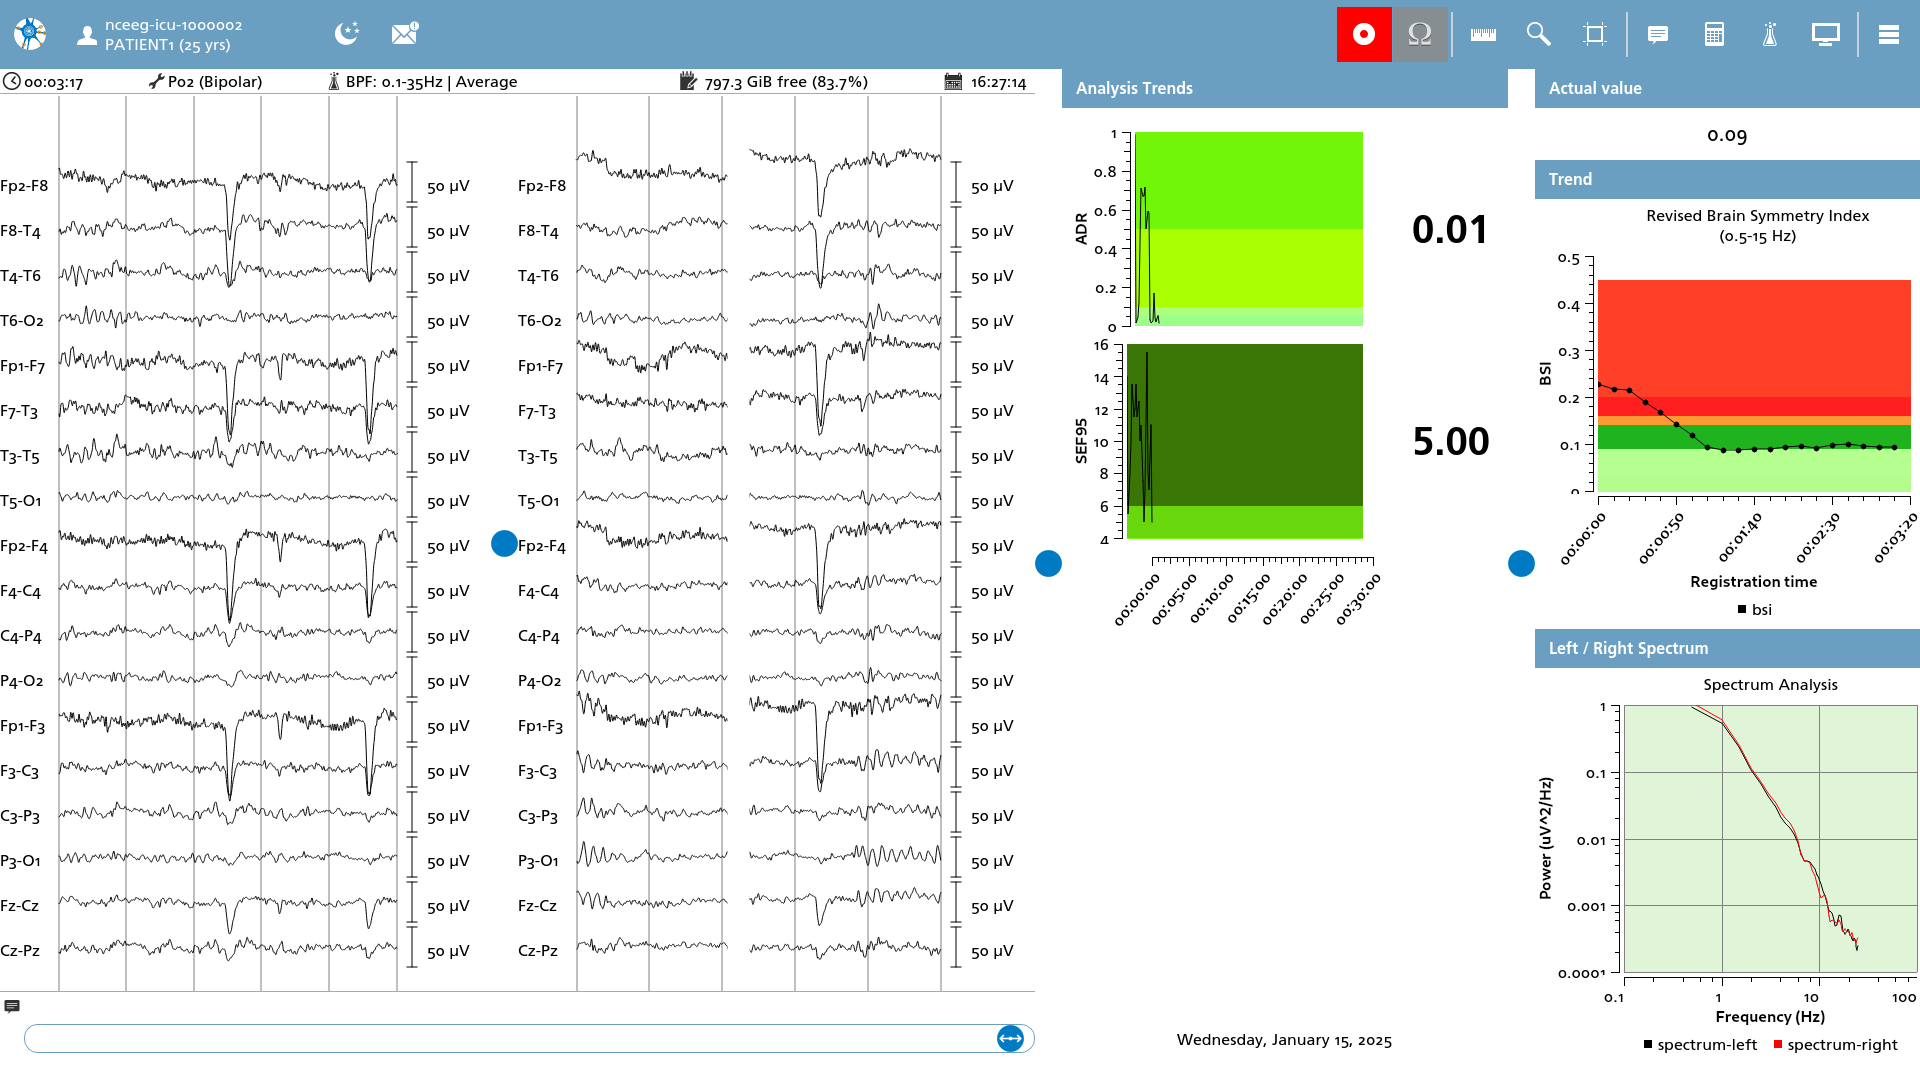
When initiating an analysis without specifying a particular region, the analysis proceeds from the start of the file up to the current position. At this juncture, the analysis remains in a waiting state until new data becomes accessible for examination. Furthermore, when the position slider in a trend output element is adjusted to the far right, indicating the end of the current file, the trend will continuously update its position as new data becomes available.
Annotations
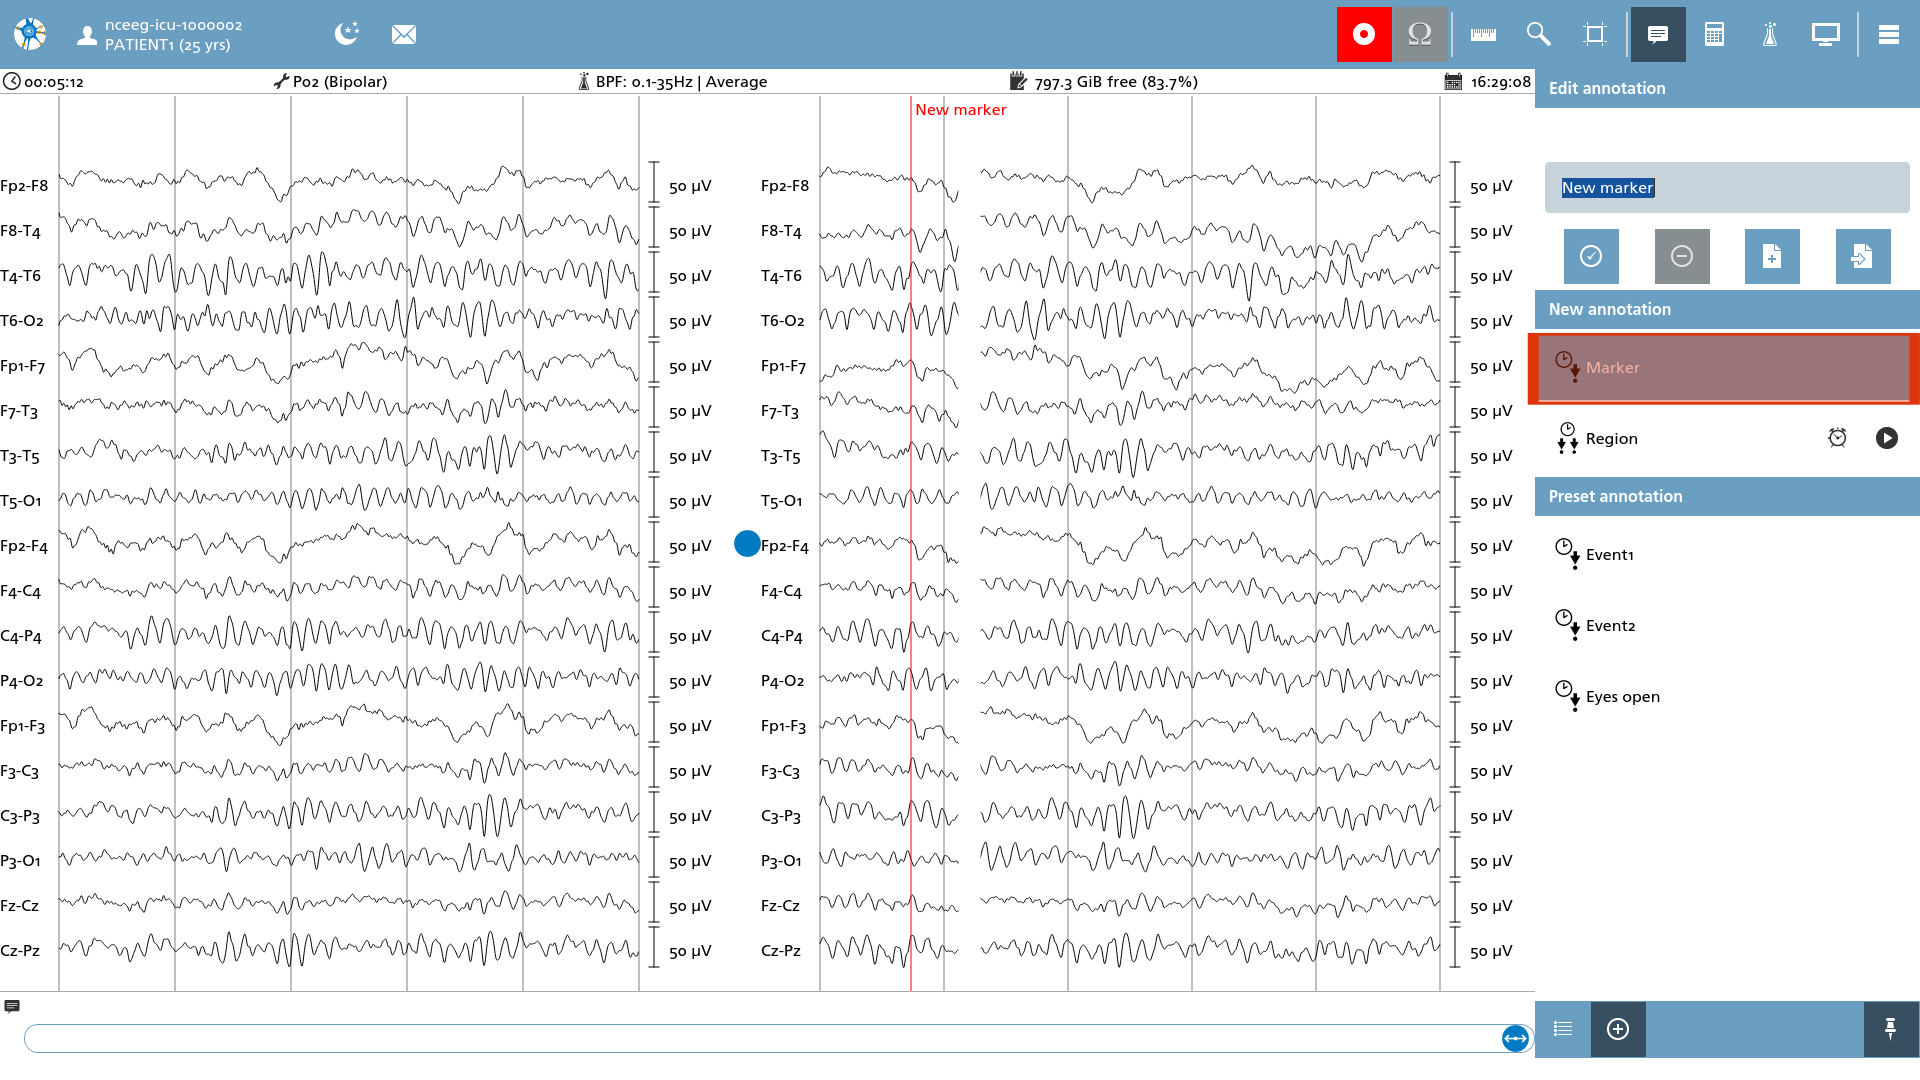
Annotations can be added from the static viewer as described in this section. In addition to this functionality, annotations can be conveniently added using the preset sub-menu located within the annotation overlay. By performing a single click on the Marker annotation, a marker is added to the real-time viewer, and the label associated with it can be modified. The same procedure applies to the Region annotation, where a new region is initiated. The timer will display the current elapsed time within this region, and the region concludes when the stop button is clicked. During this process, the label can also be edited. For enhanced efficiency, label editing can be automated by utilizing preset annotations through the same mechanism.